Figure 4. CNV detection of chromosome 6q duplication. Copy number change in the CCNC-PRDM13 regions for affected individuals (n = 3) relative to unaffected individuals (n = 2), as computed by the log2 ratio of the
read depth. Blue points represent the log2 ratio inferred from the mean depth in 100-bp bins. Red lines indicate the copy
number segments inferred by the DNAcopy R package.
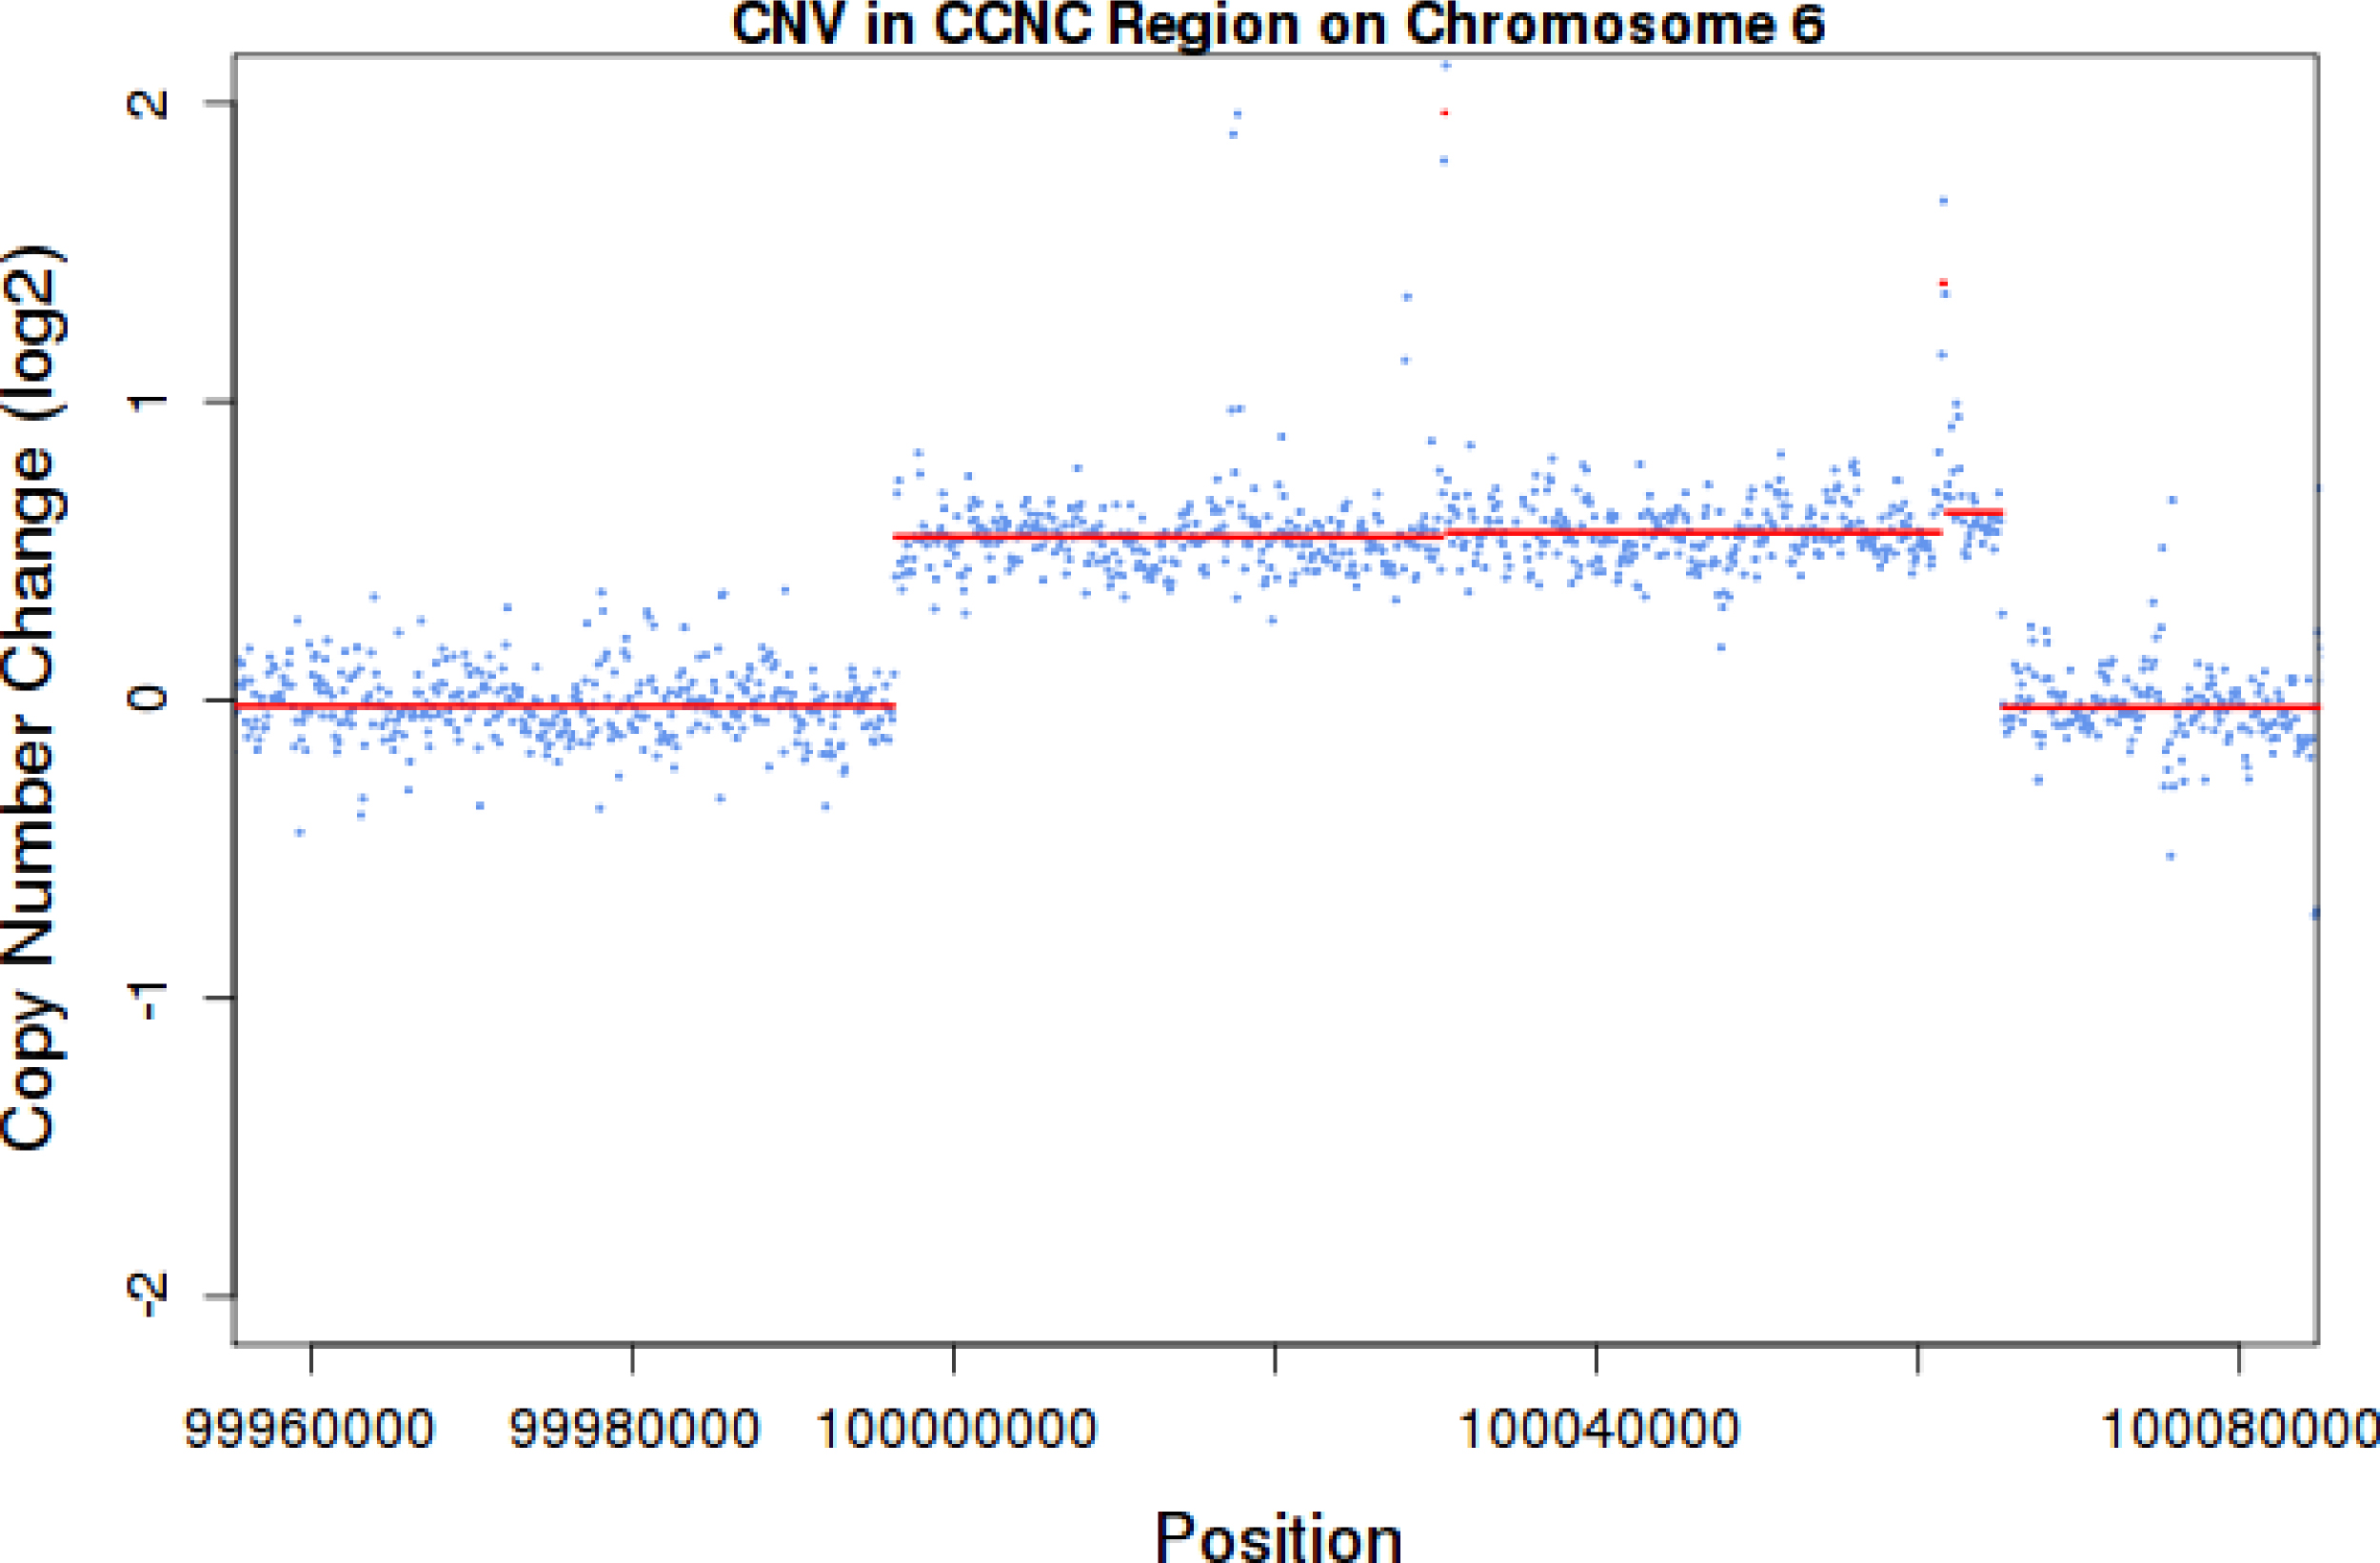
 Figure 4 of
Bowne, Mol Vis 2016; 22:1239-1247.
Figure 4 of
Bowne, Mol Vis 2016; 22:1239-1247.