Figure 2. FdOCT. Each figure represents a b-scan through the macula from either a 9 mm line or volume scan. The scans consist of 100
or 15+ averaged scans taken with autoretinal tracking. The location of each scan is shown in the infrared image (bold green
line). A: Grade 1 eye in 9395. B: Grade 2 eye in 8688. C: Grade 3 eyes in 9395, 8602, and 8686, respectively.
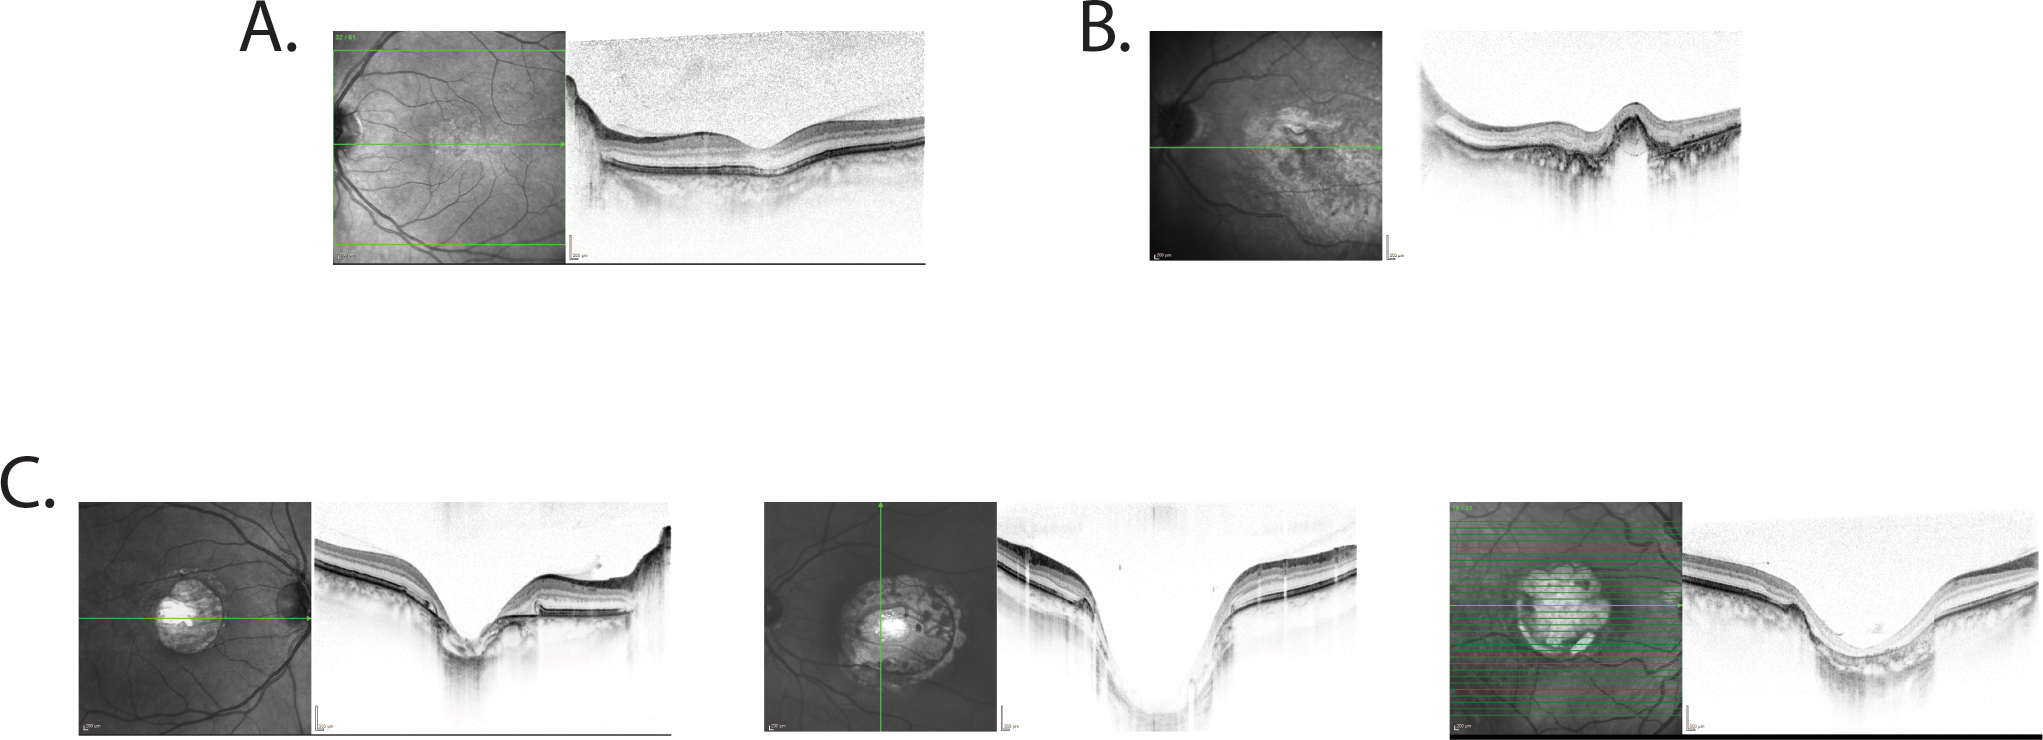
 Figure 2 of
Bowne, Mol Vis 2016; 22:1239-1247.
Figure 2 of
Bowne, Mol Vis 2016; 22:1239-1247.