Figure 2. Histological analysis of human LG and SMG tissue. Postmortem tissue was fixed and processed for paraffin embedding followed
by hematoxylin and eosin staining. Each column represents tissue from different donors. Scale bar represents 50 µm in A, C, E, G, I, K (magnification 200X) and 25 µm in B, D, F, H, J, L (magnification 400X). sA, serous acinus; mA, mucous acinus; Ad, adipocytes. Arrows depict examples of serous-mucous acini.
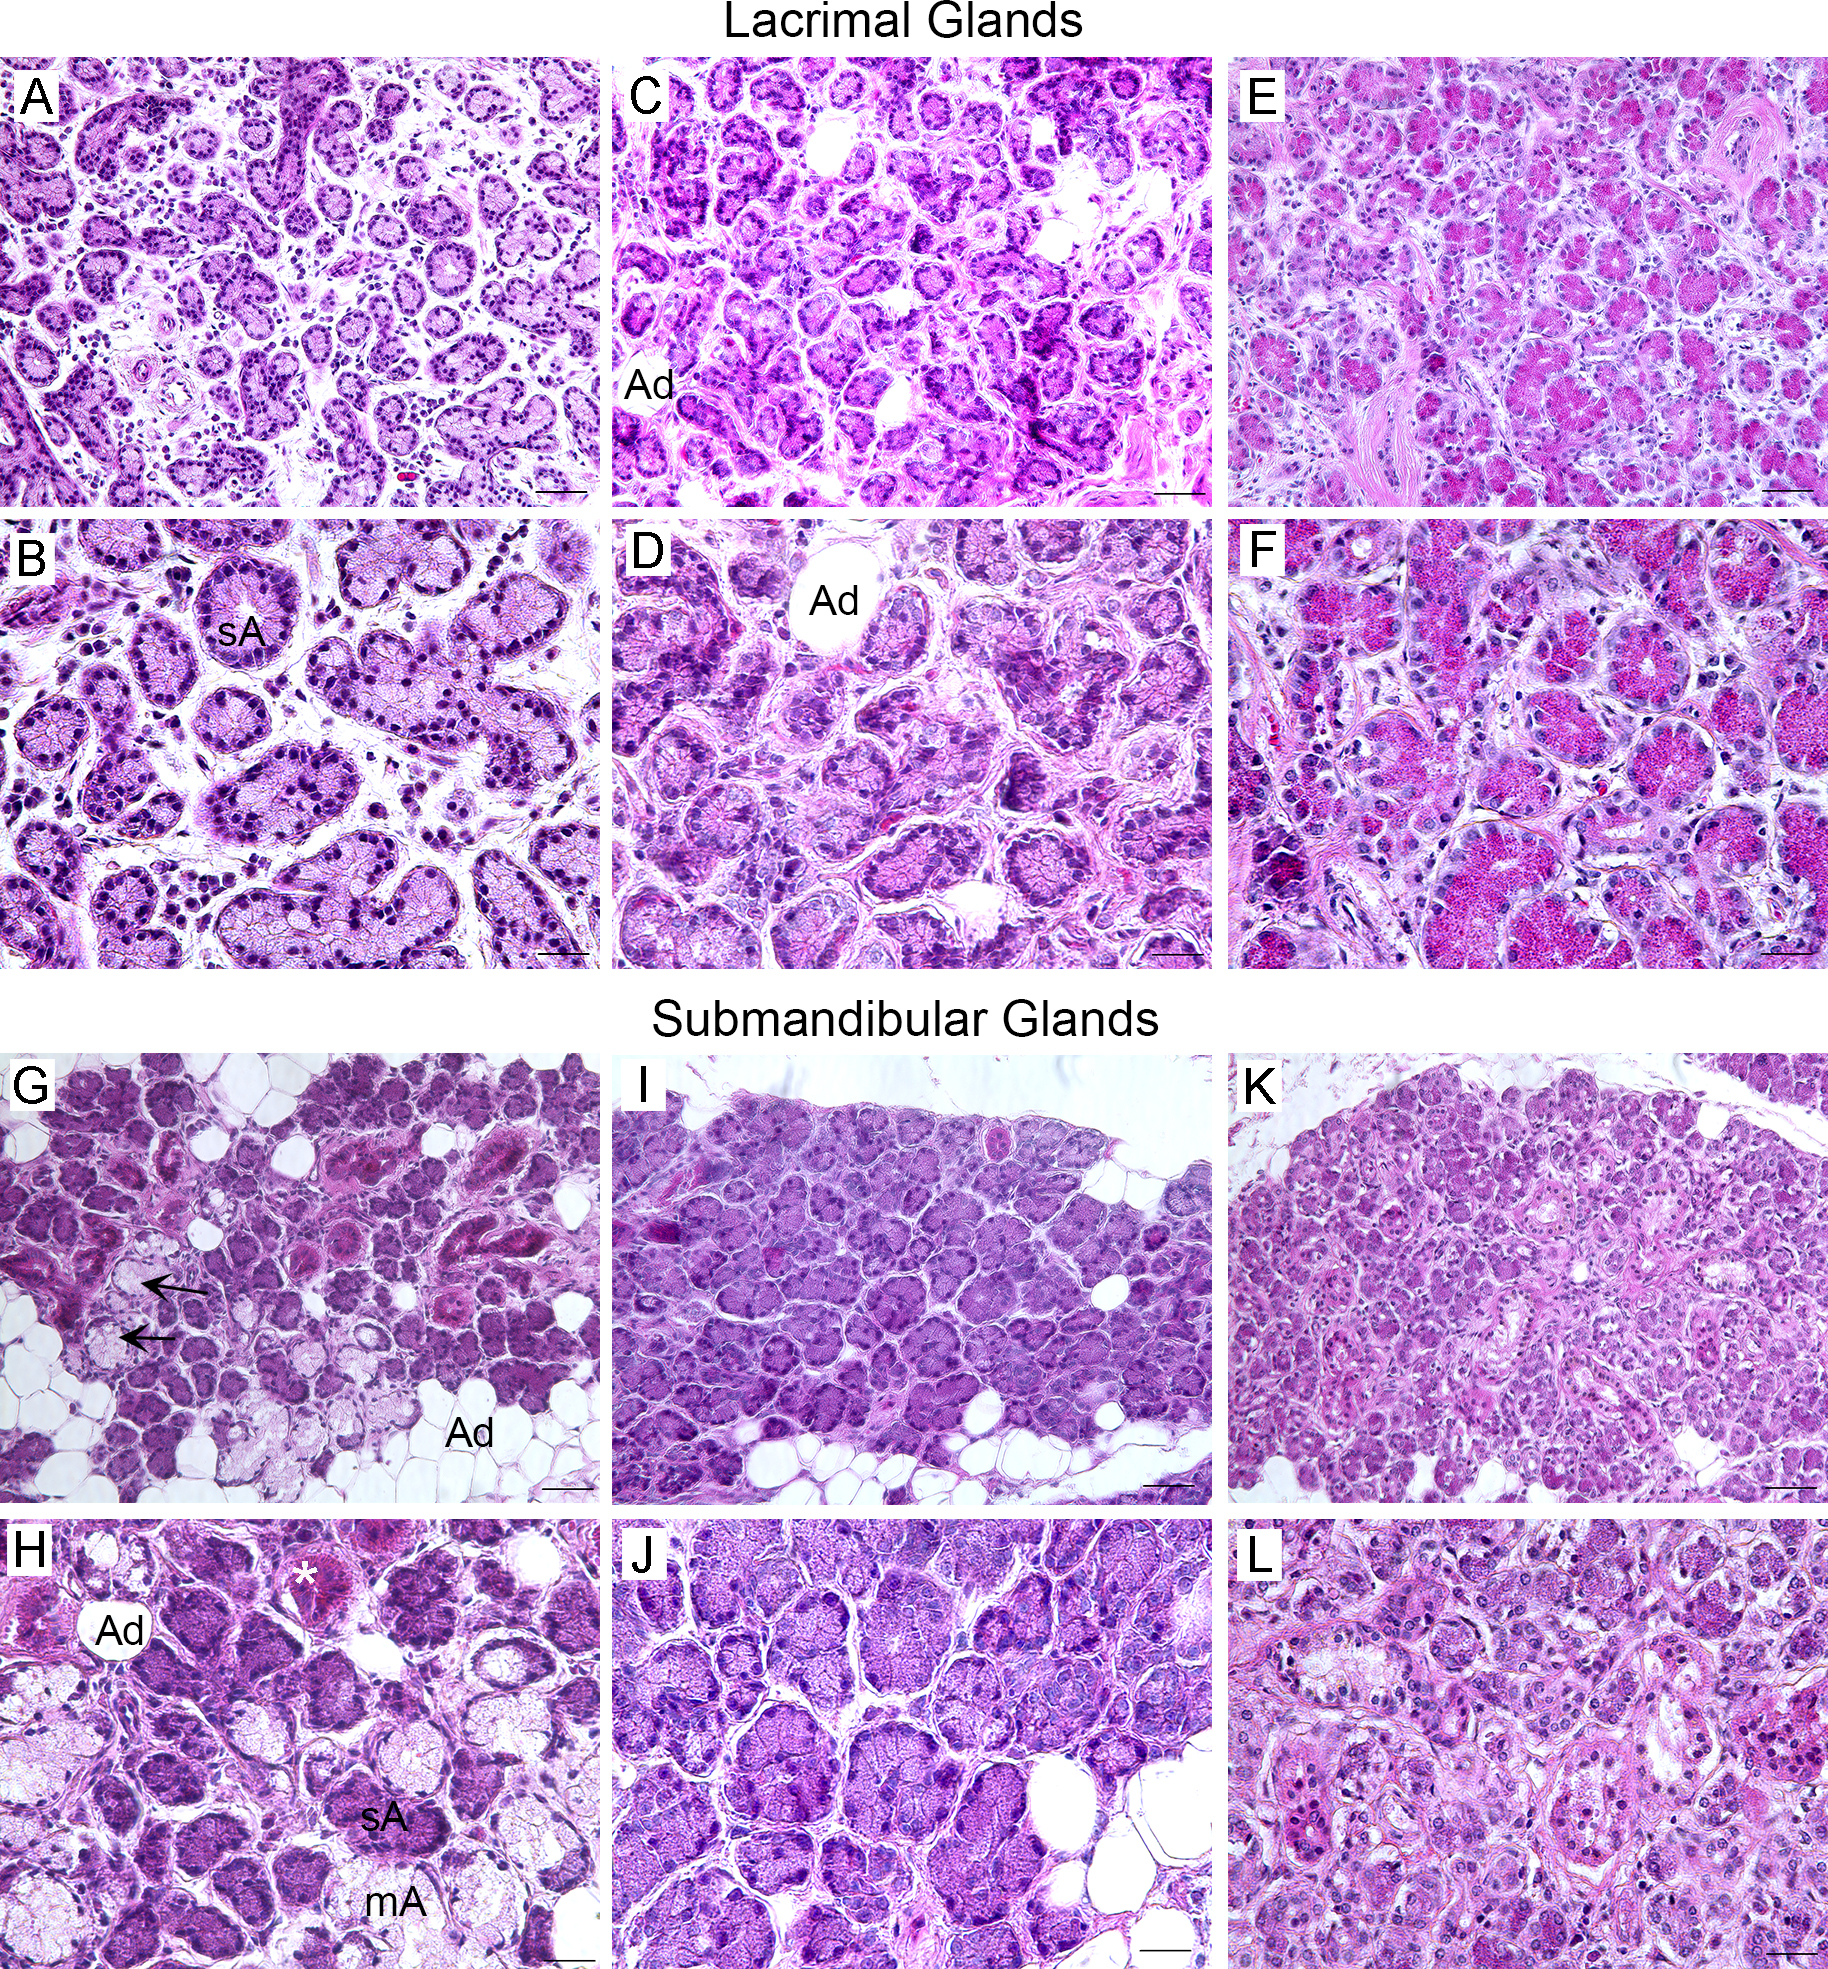
 Figure 2 of
Hawley, Mol Vis 2016; 22:1221-1228.
Figure 2 of
Hawley, Mol Vis 2016; 22:1221-1228.