Figure 6. Aralar-deficient mice have a reduced rate of recovery in the double flash test. Typical electroretinogram (ERG) traces of
the control (A) and knockout (B) paired-flash stimulation with the indicated time intervals for the second flash (the first flash of the paired stimulation
is shown only for the first recording [leftmost]). The flash intensity was 1.5 log Cds/m2 in scotopic conditions (the mixed protocol from Appendix 2). Amplitude (μV) versus the interval time plot of the second flash
a-wave (C) and b-wave (E) for the control (black) and knockout (gray) mice. D, F: Corresponding histograms showing % values of the respective single flash amplitude. G: Calculated b-wave to a-wave ratio in the second flash ERG response at the different intervals. Basal refers to the initial
single flash recording. * p<0.05; ** p<0.005 for statistical difference between genotypes (the Student t test). Data are expressed as mean ± standard error of the mean (SEM) of n = 4 (control) and n = 5 (knockout) mice.
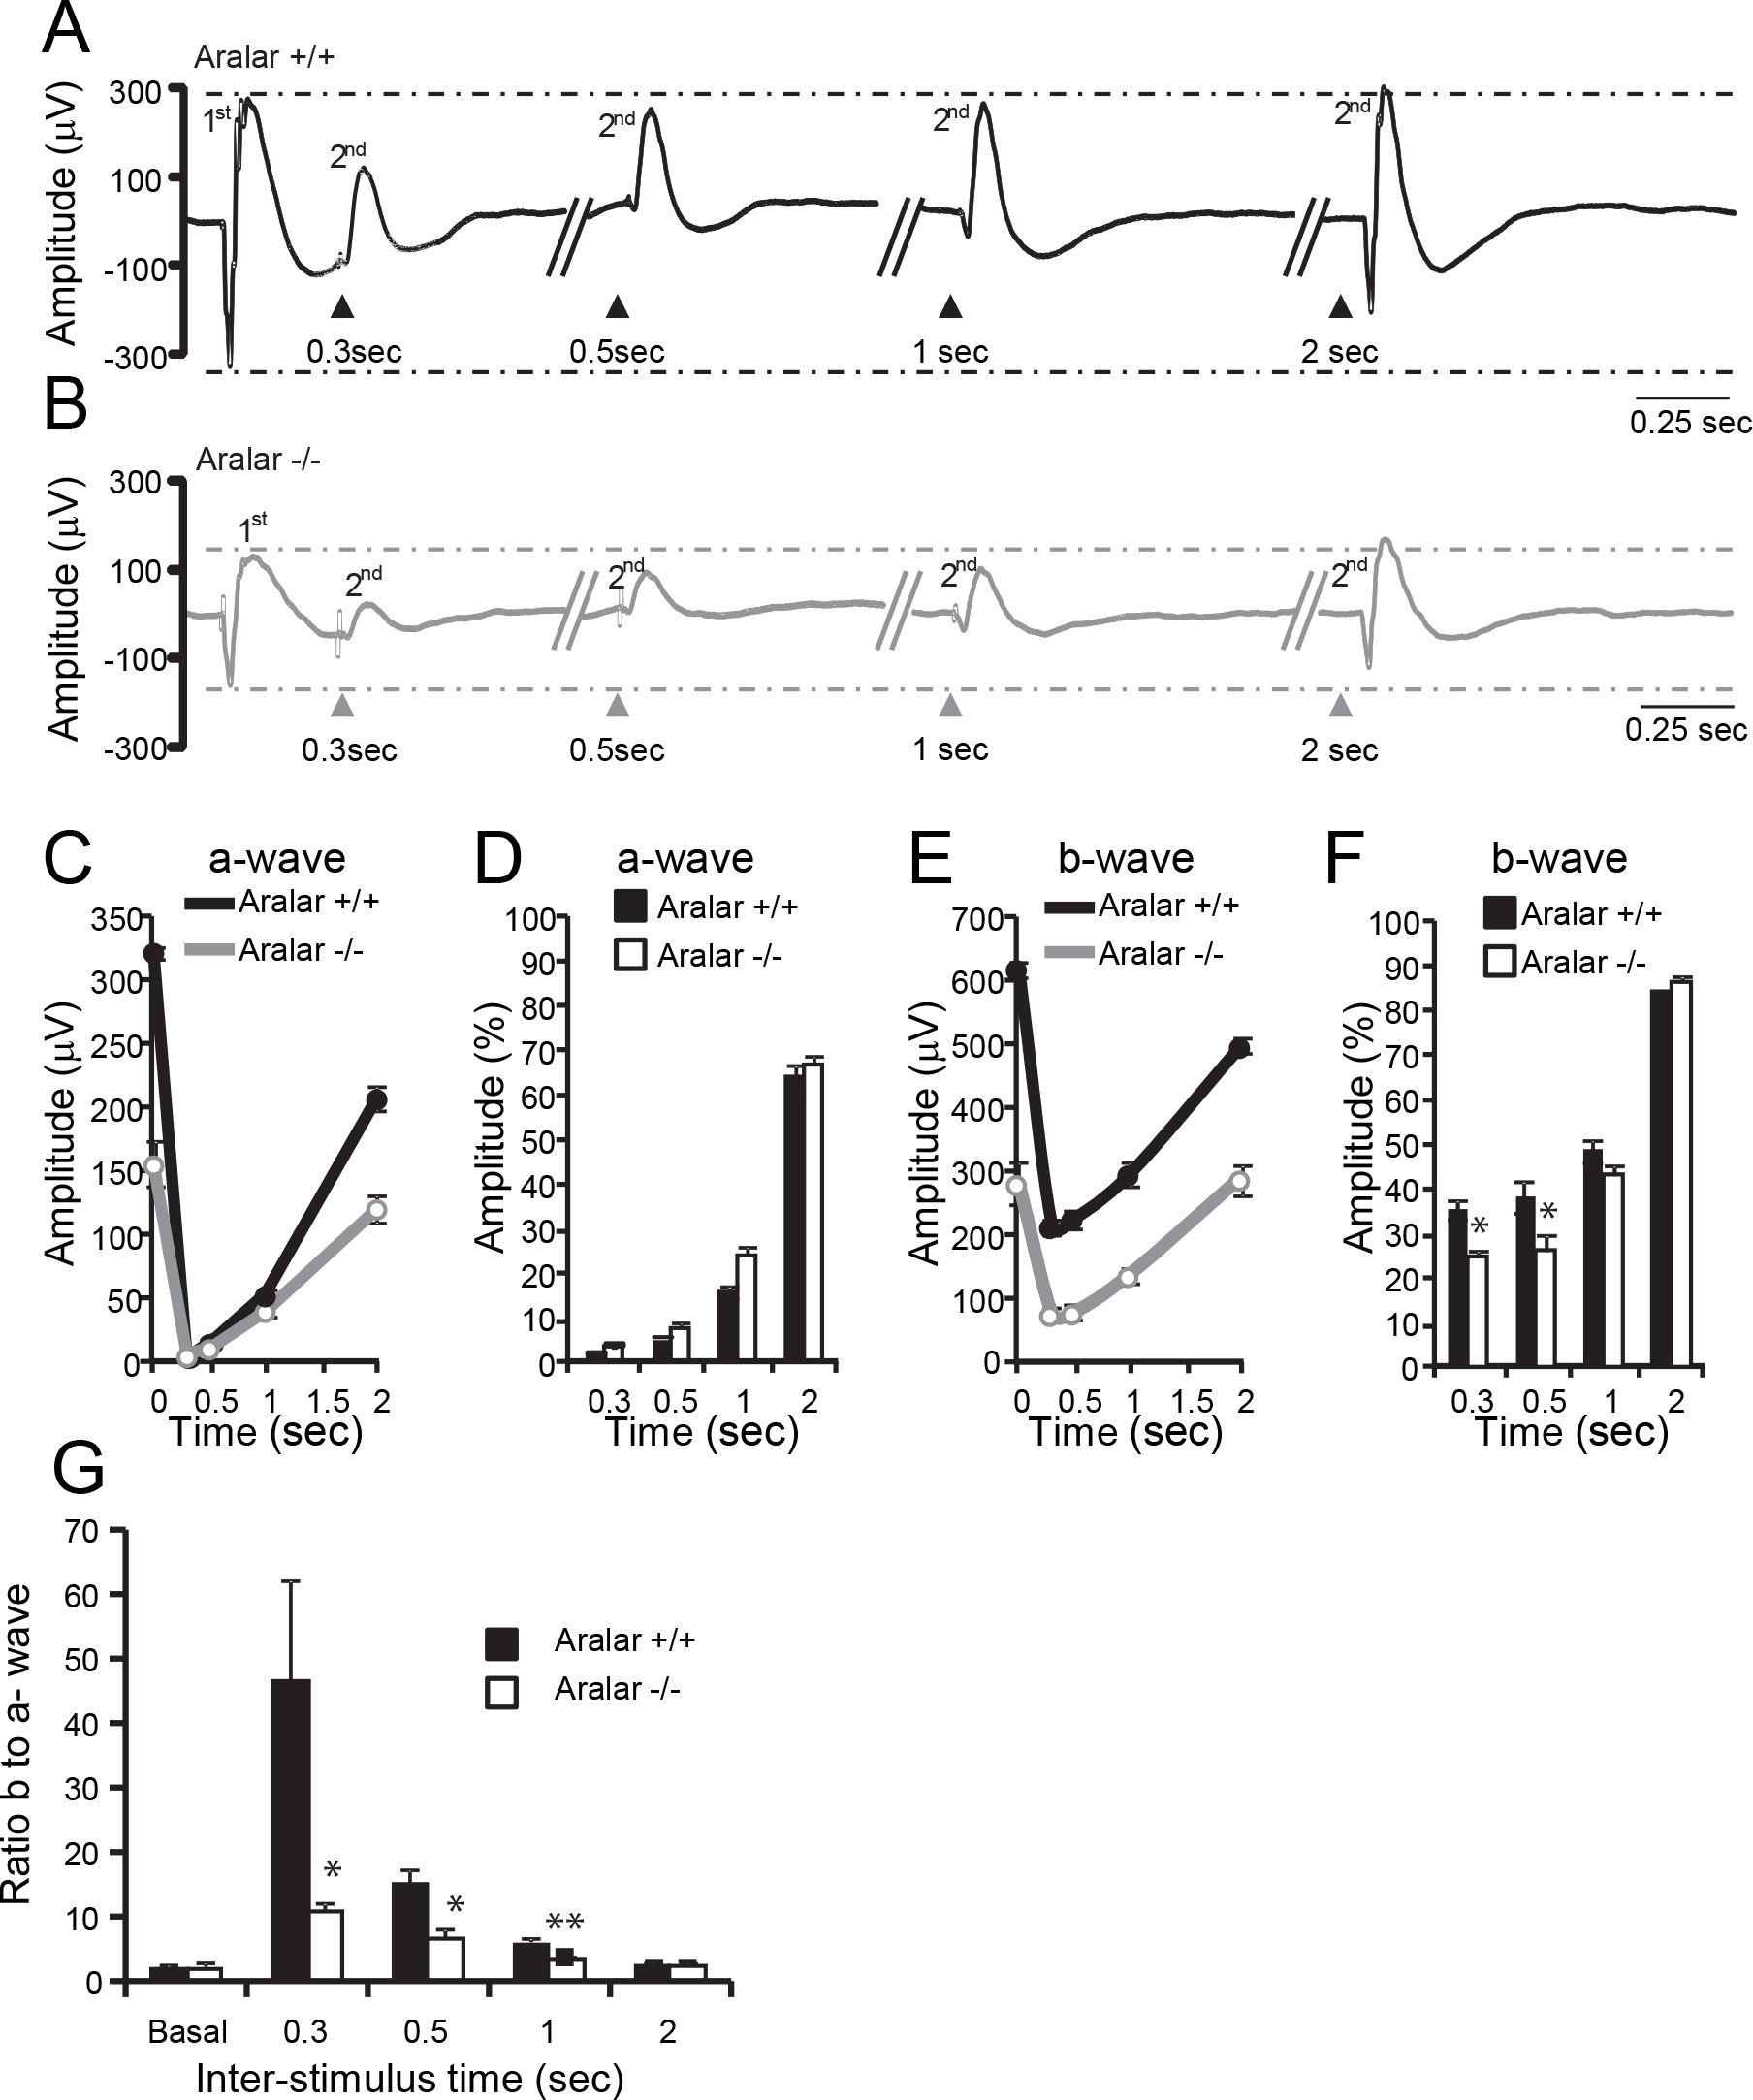
 Figure 6 of
Contreras, Mol Vis 2016; 22:1198-1212.
Figure 6 of
Contreras, Mol Vis 2016; 22:1198-1212.