Figure 5. Aralar-deficient retinas recover faster after light illumination. Typical electroretinogram (ERG) mixed wave recordings from
control (A) and knockout (B) mice obtained after overnight dark-adaptation (DA) and at different time points (0.16, 5, 12.5, 20, 27.5, 35, 42.5, and
50 min) after 5 min exposure to light. Measured amplitudes of a-wave (C) and b-wave (D) of control (black, filled circles) and knockout mice (gray, white circles) for full dark-adapted (DA) or at the indicated
time points after light exposure. * p<0.05, statistically significant difference with dark-adapted amplitude. E, F: Corresponding histograms of normalized amplitudes to dark-adapted (DA) values. * p<0.05, statistically significant difference
between genotypes. Data are expressed as mean ± standard error of the mean (SEM) of n = 7 (control) and n = 4 (knockout) mice.
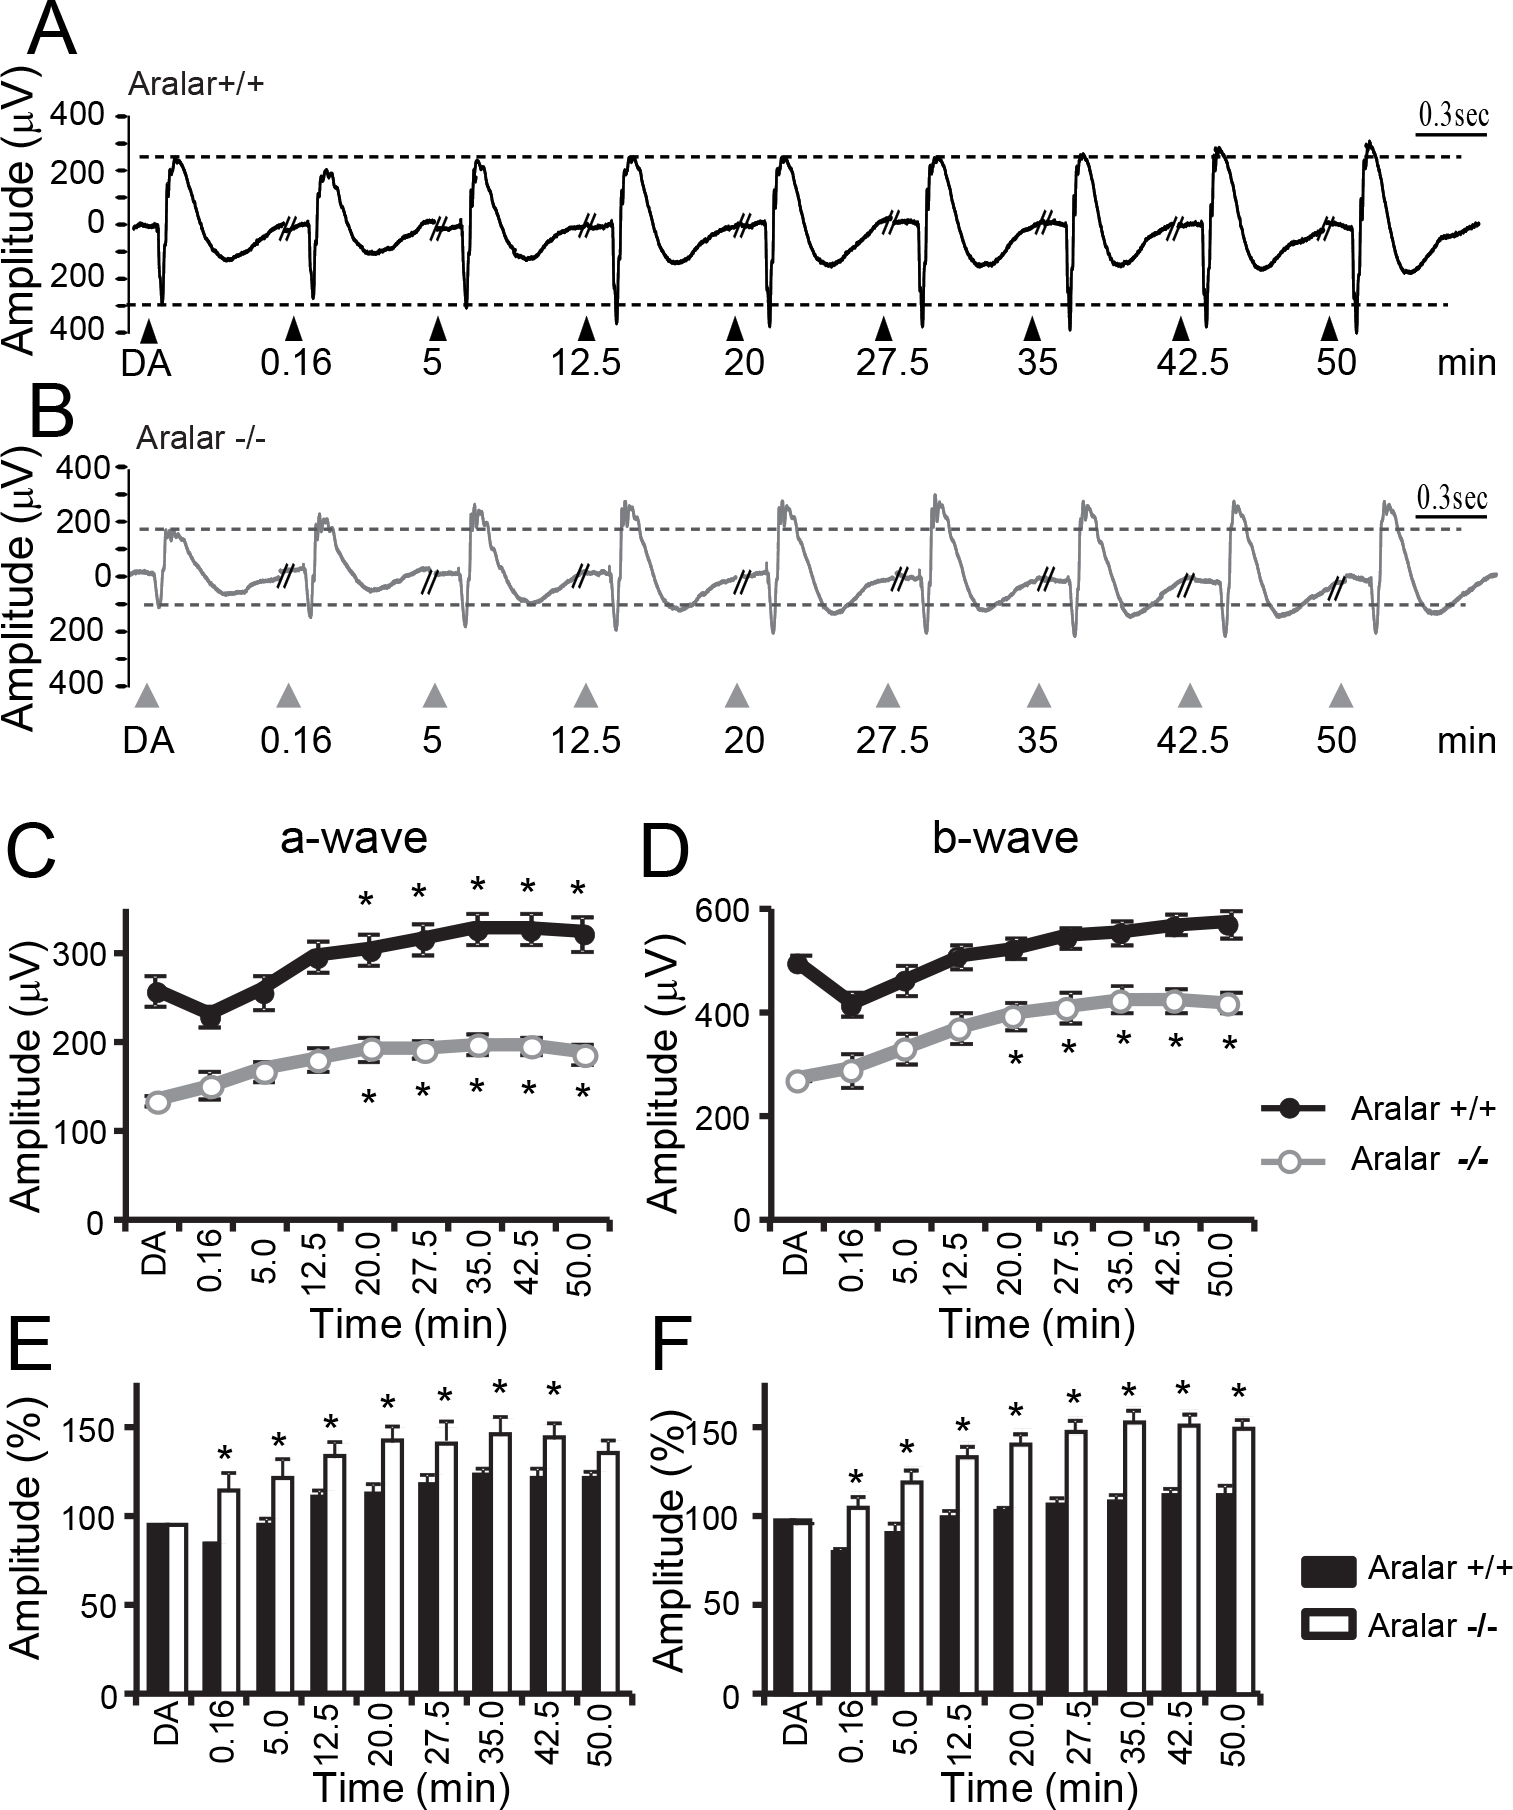
 Figure 5 of
Contreras, Mol Vis 2016; 22:1198-1212.
Figure 5 of
Contreras, Mol Vis 2016; 22:1198-1212.