Figure 4. Aralar-deficient retinas show decreased light-evoked response after overnight dark-adaptation. Standard electroretinogram
(ERG) representative trace recordings from control (black line) and aralar-deficient (red line) overnight dark-adapted animals.
See for comparison the differences between the two genotypes in the trace amplitudes. Dim scotopic response (DSR, −4 log Cds/m2), rod response (b-scot, −2 log Cds/m2), rod and cone response (mixed, a- and b-waves, 1.5 log Cds/m2), and oscillatory potential (OP, 1.5 log Cds/m2) were recorded sequentially under scotopic conditions, i.e., a dark background. Cone (b-phot, 2 log Cds/m2) and flicker (2 log Cds/m2) responses were recorded after 5 min light-adaptation under photopic conditions, i.e., light background. Note that the OP
and flicker responses were separated in the vertical axis to better present the genotype’s waveform. B: B-wave amplitude in scotopic conditions at the different flash intensities. C: Histogram representation of the ERG wave amplitudes from the knockout (white bars) and control (black bars) animals. Wave
amplitudes were averaged from a total of seven (A, E, F) and 12 (B, C, D) mice from each genotype. Data are shown as mean ± standard error of the mean (SEM); *** p<0.00001, **, p<0.0001, * p<0.01
for statistically significant differences between the genotypes (n = 7-12 each genotype).
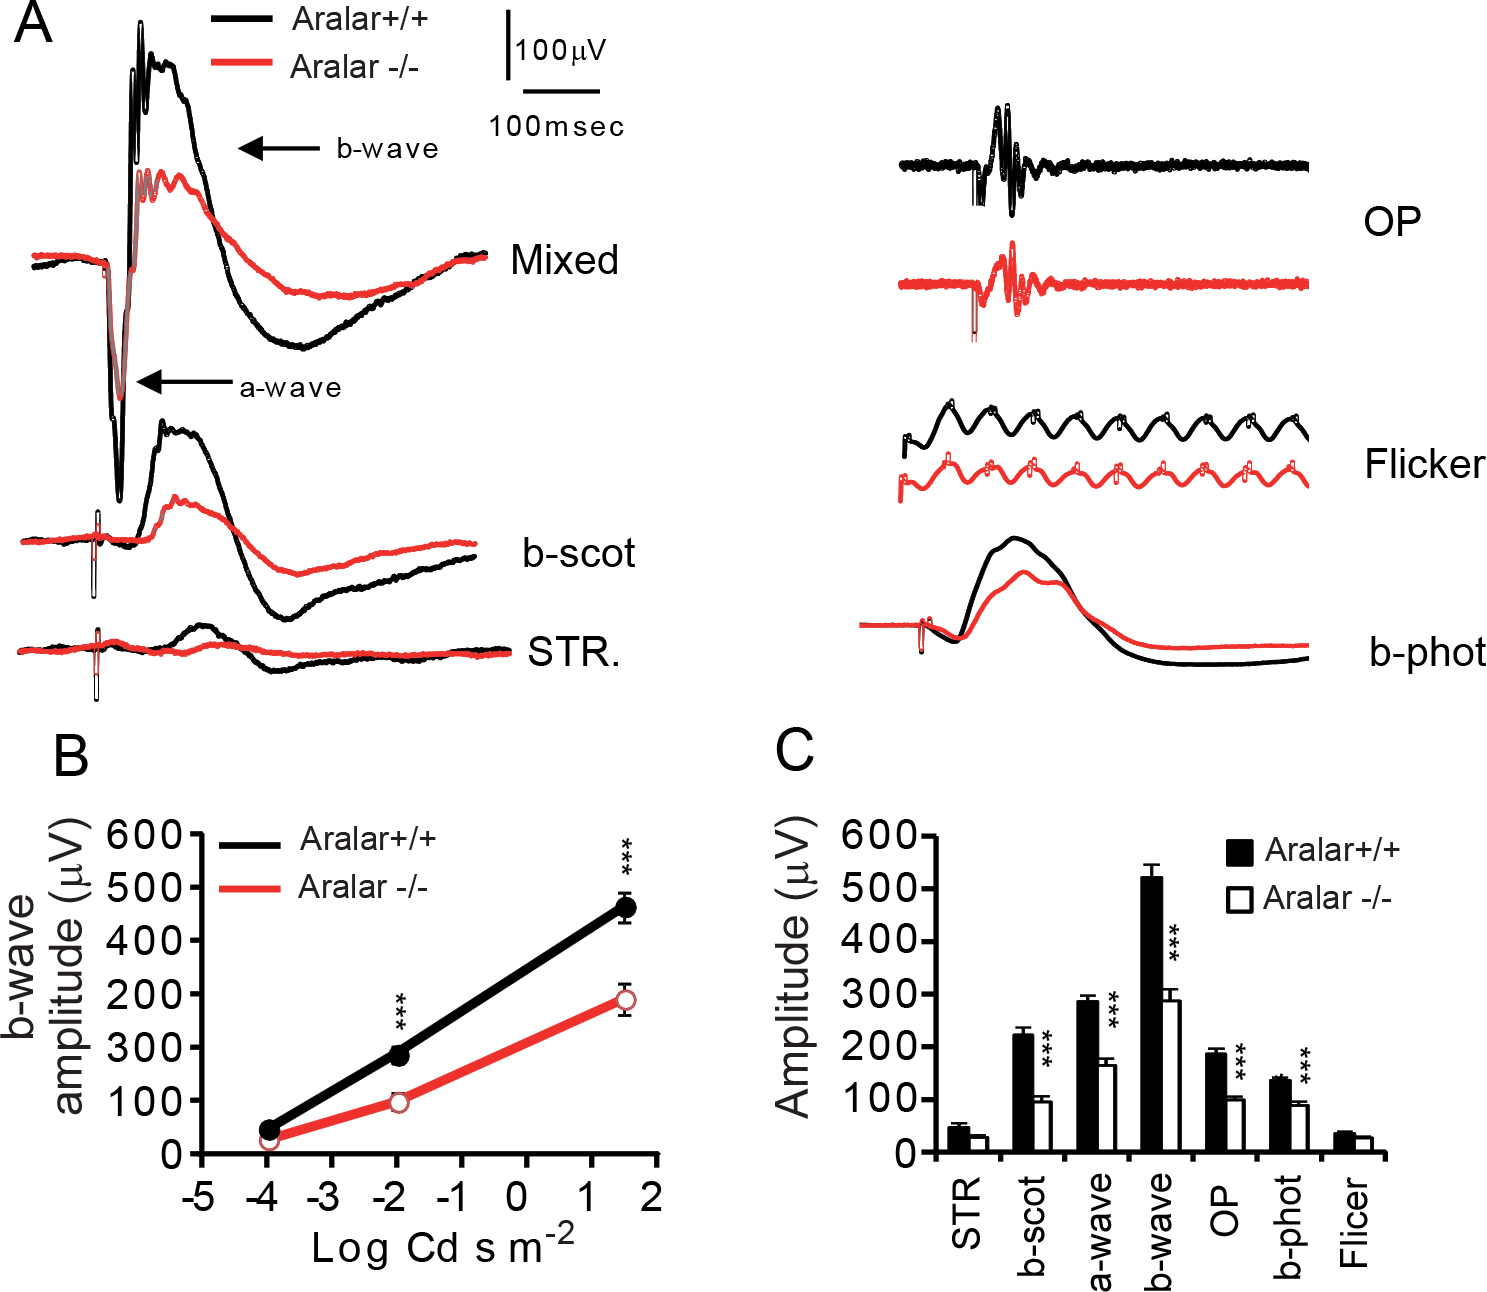
 Figure 4 of
Contreras, Mol Vis 2016; 22:1198-1212.
Figure 4 of
Contreras, Mol Vis 2016; 22:1198-1212.