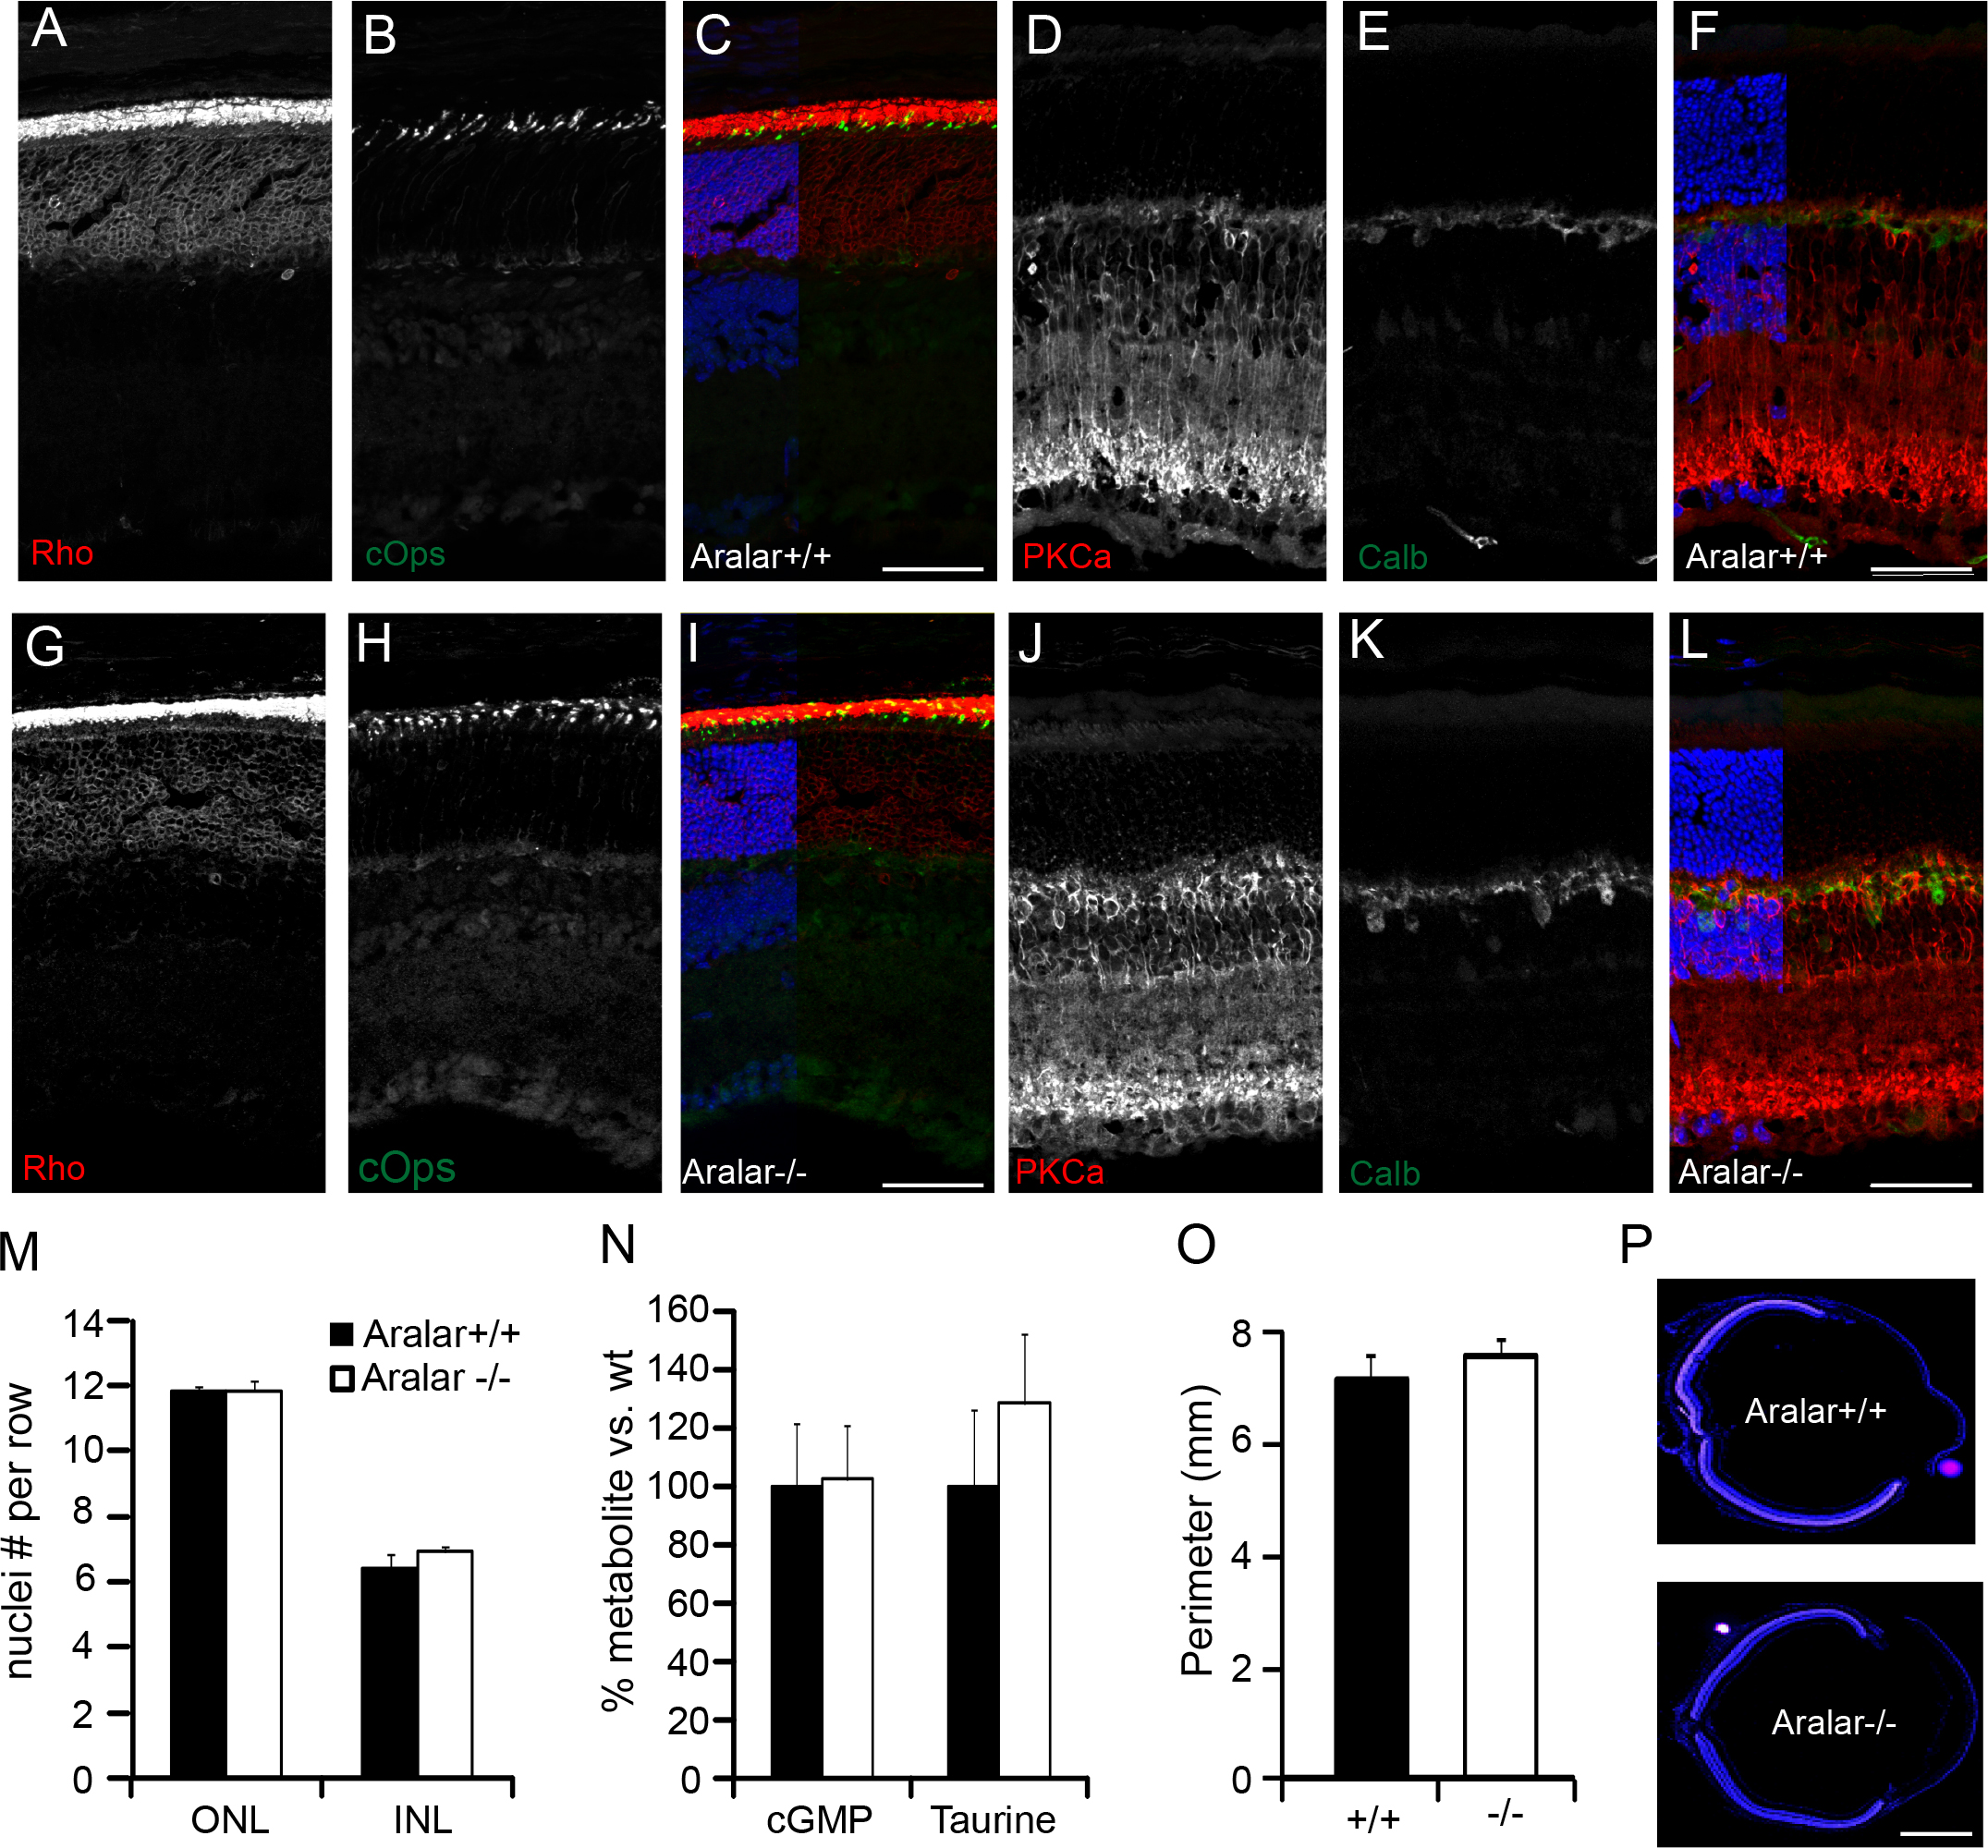
Figure 3. Cellular distribution is normal in aralar-deficient retinas. Fixed retinas from control (
A-
F) and aralar-deficient (
G-
L) mice (n = 3 each genotype, three independent assays) were probed with antibodies against rhodopsin (
A,
G), c-Opsin (
B,
H), protein kinase C alpha (PKC-α;
D,
J), and calbindin (
E,
K), which label the rods, cones, rod bipolar cells, and horizontal (as well as some amacrine and displaced amacrine) cells,
respectively [
67,
68]. Nuclei stained with 4',6-diamidino-2-phenylindole (DAPI) are shown in blue in the merged images (
C,
F,
I,
L). Scale bar = 50 μm.
M: Photoreceptor and inner retinal neuron density was estimated by counting the number of nuclei in rows at intervals from
the optic nerve head (ONH) to the periphery (three rows of nuclei from three different sections from three animals per genotype).
N: Taurine and cGMP levels from control (n = 6) and aralar-deficient (n = 8) retinas. Retinas were isolated in light conditions
and processed as described previously [
33,
35] for metabolite extraction and gas chromatography/mass spectrometry analysis. Note that there are no significant differences
between genotypes.
O: Measured retinal size as the perimeter along the outer plexiform layer of the control and aralar-deficient mice as shown
in
P. Scale bar = 1 mm. Data are shown as mean ± standard error of the mean (SEM); n = 3. No significant difference between genotypes
was found. (Student's t test).
 Figure 3 of
Contreras, Mol Vis 2016; 22:1198-1212.
Figure 3 of
Contreras, Mol Vis 2016; 22:1198-1212.