Figure 2. Morphological analysis of the retina shows no differences between the control and aralar-deficient retinas. Hematoxylin and
eosin staining of control (A) and aralar-deficient (E) retinas. Scale bar = 100 μm. Insets correspond to the enlarged outer segment (OS), the outer nuclear layer (ONL; B, F), outer plexiform (OPL), inner nuclear layers (INL; C, G), inner plexiform (IPL), and granule cell layers (GCL; D, H). Scale bar = 10 μm. I-L: Histograms of measured thickness of the indicated layers along the optic nerve head meridian. (n = 3 for control and n =
3 for aralar-deficient retinas). (Student's t test).
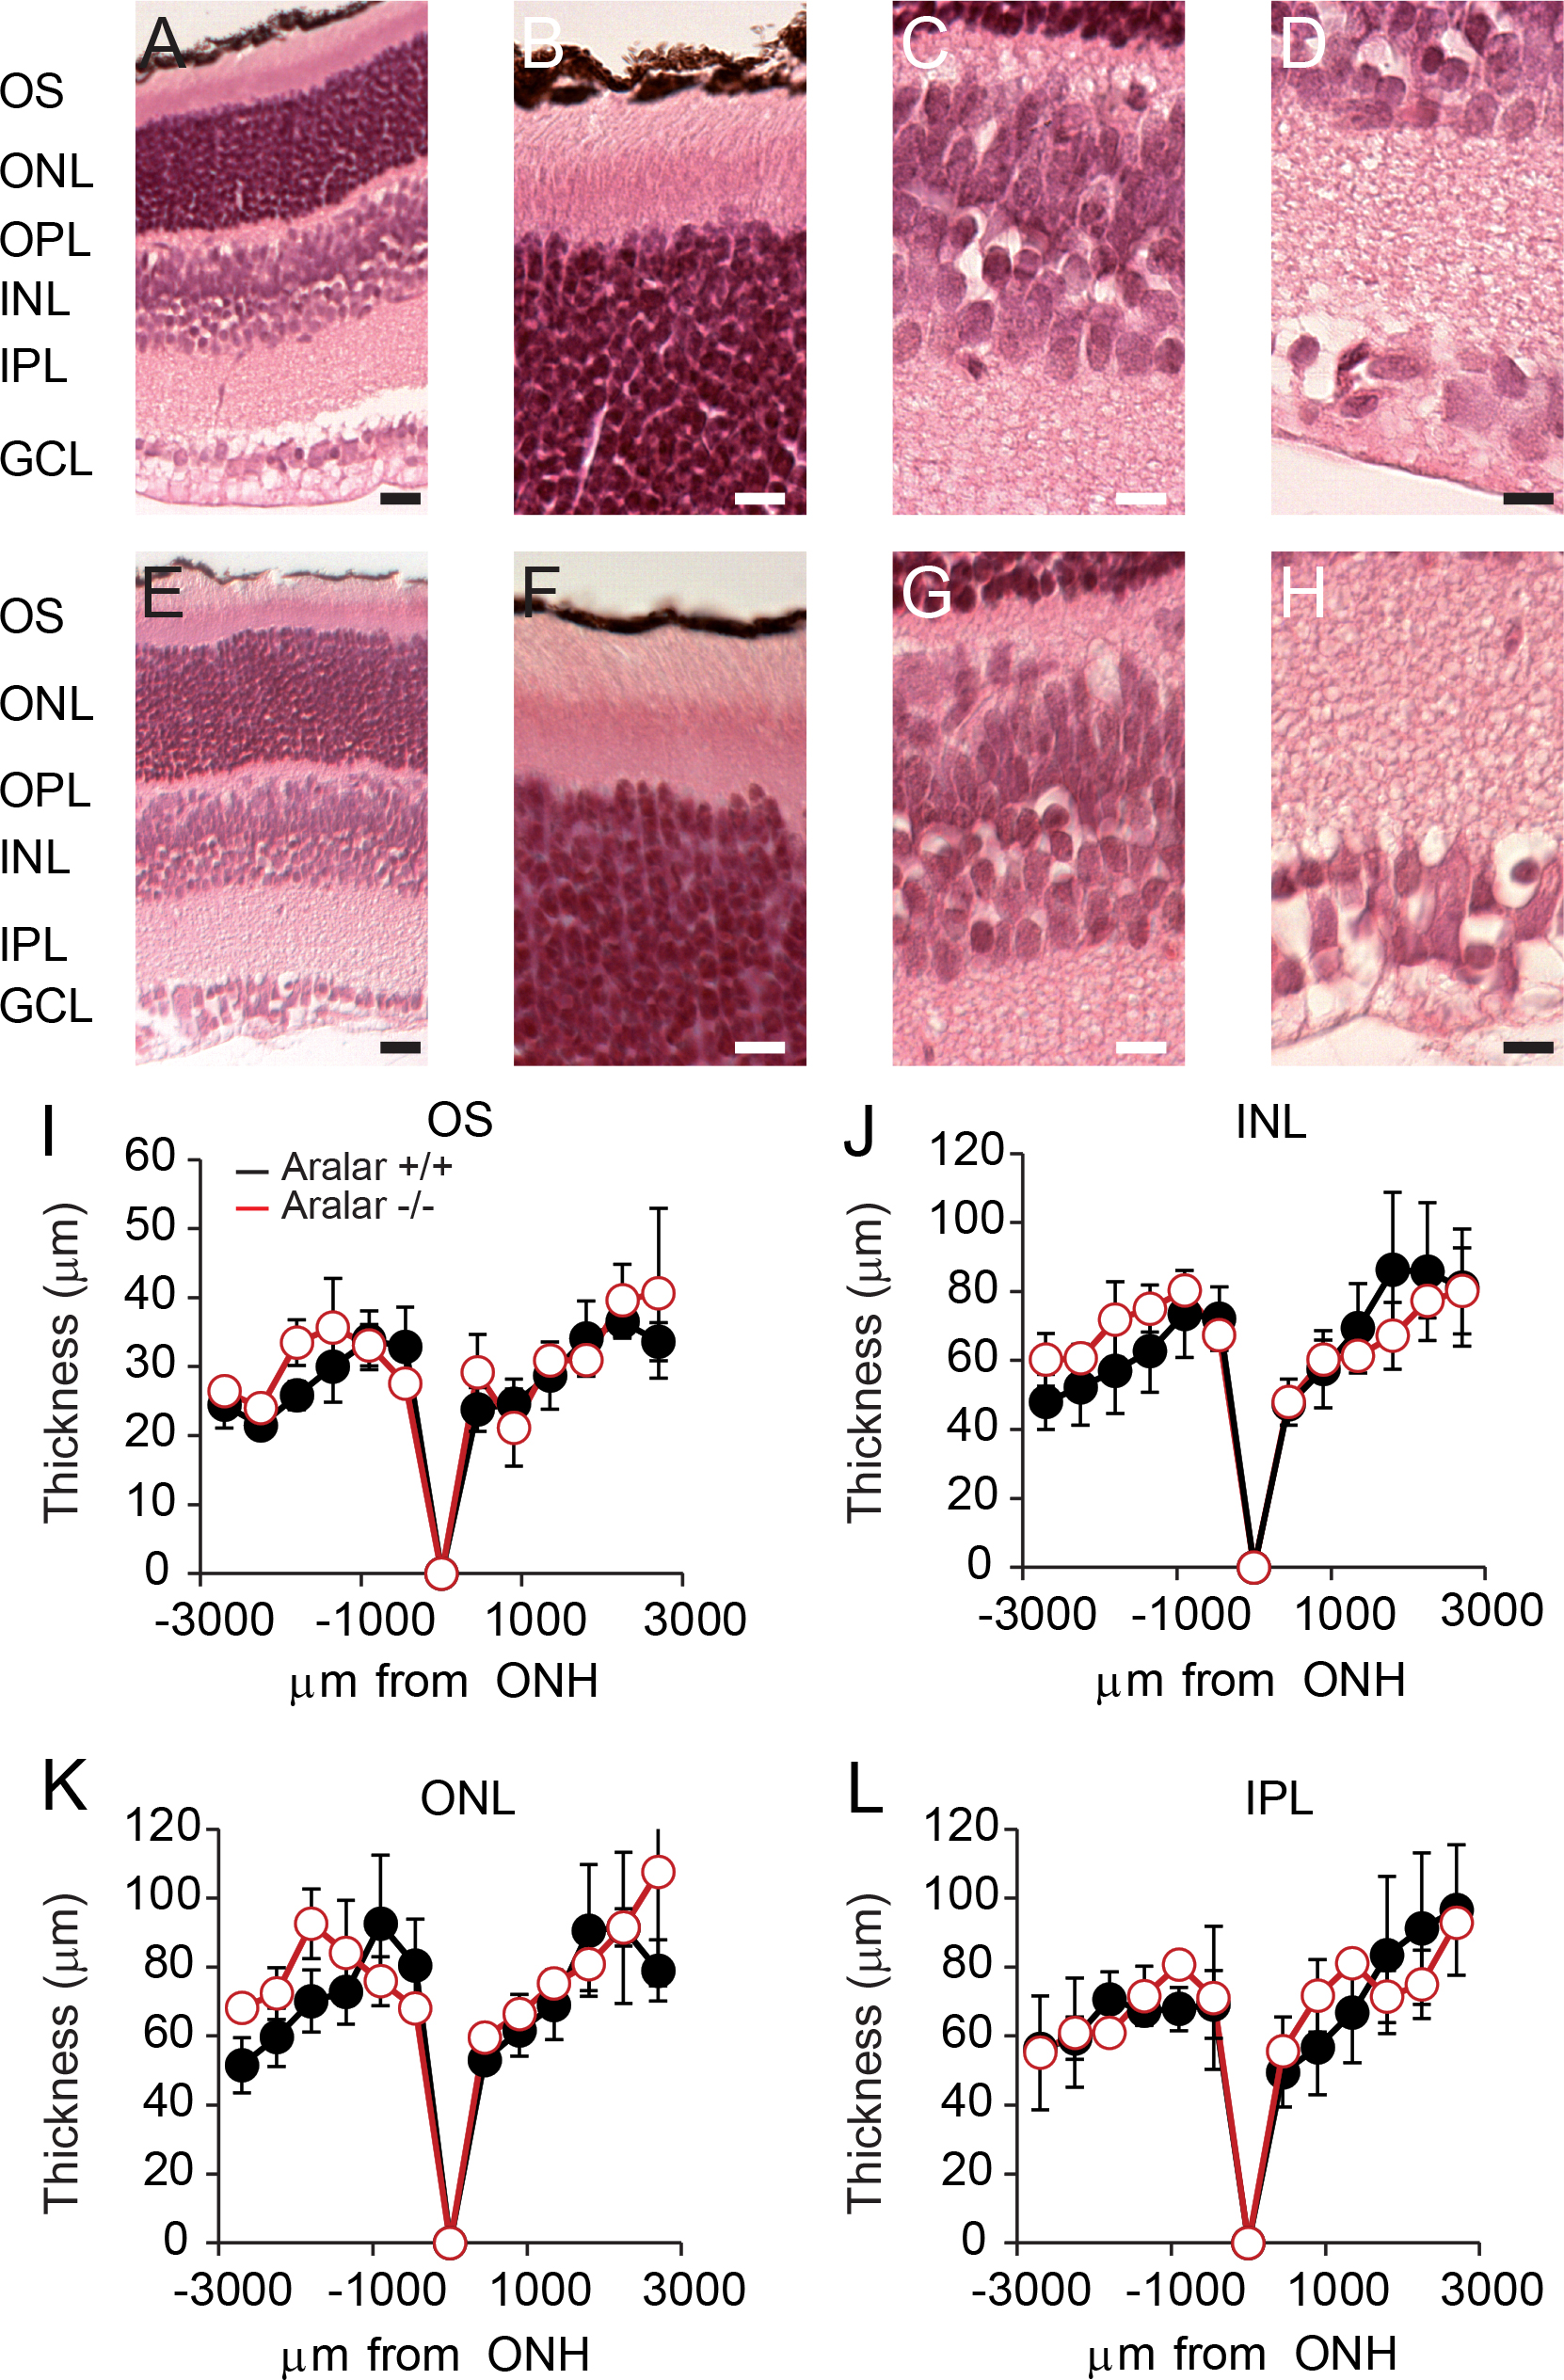
 Figure 2 of
Contreras, Mol Vis 2016; 22:1198-1212.
Figure 2 of
Contreras, Mol Vis 2016; 22:1198-1212.