Figure 3. Electroretinographic evaluation of retinal function. Rod and cone electroretinogram (ERG) performance (see detailed information
in Methods) at the PI30 day demonstrated that the amplitudes from all nanoceria-injected groups are comparable to those of
the uninjected mice. Data shown are mean ± standard error of the mean (SEM), and there are no statistically significant differences
among the groups. n = 3–6 animals.
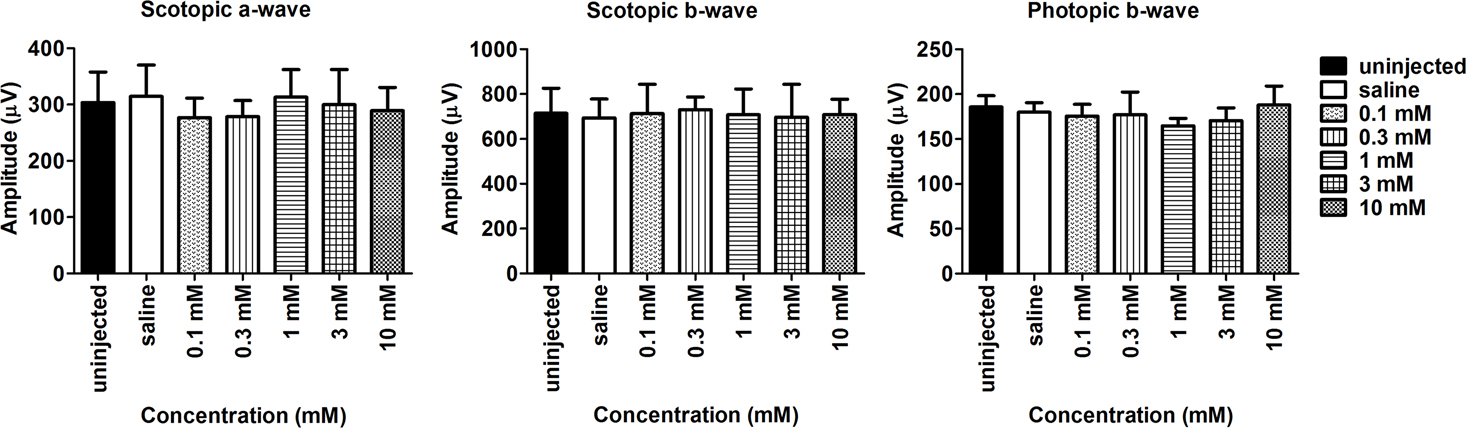
 Figure 3 of
Cai, Mol Vis 2016; 22:1176-1187.
Figure 3 of
Cai, Mol Vis 2016; 22:1176-1187.