Figure 1. Melt temperatures of individual PCR products. A: 2.5% ethidium bromide stained agarose gel showing the results of simplex PCR amplification of 3460A, 1177A, and 14484C allele–specific
products and insulin and control product (1, 2, 3, 4, respectively). B: Melt curve generated on ABI 7500 Fast of the same products demonstrating the different melting temperatures of the allele-specific
products and the control products. 3460A, 82.58 °C; 11778A, 80.32 °C; 14484C, 76.31 °C; INS, 90.24 °C.
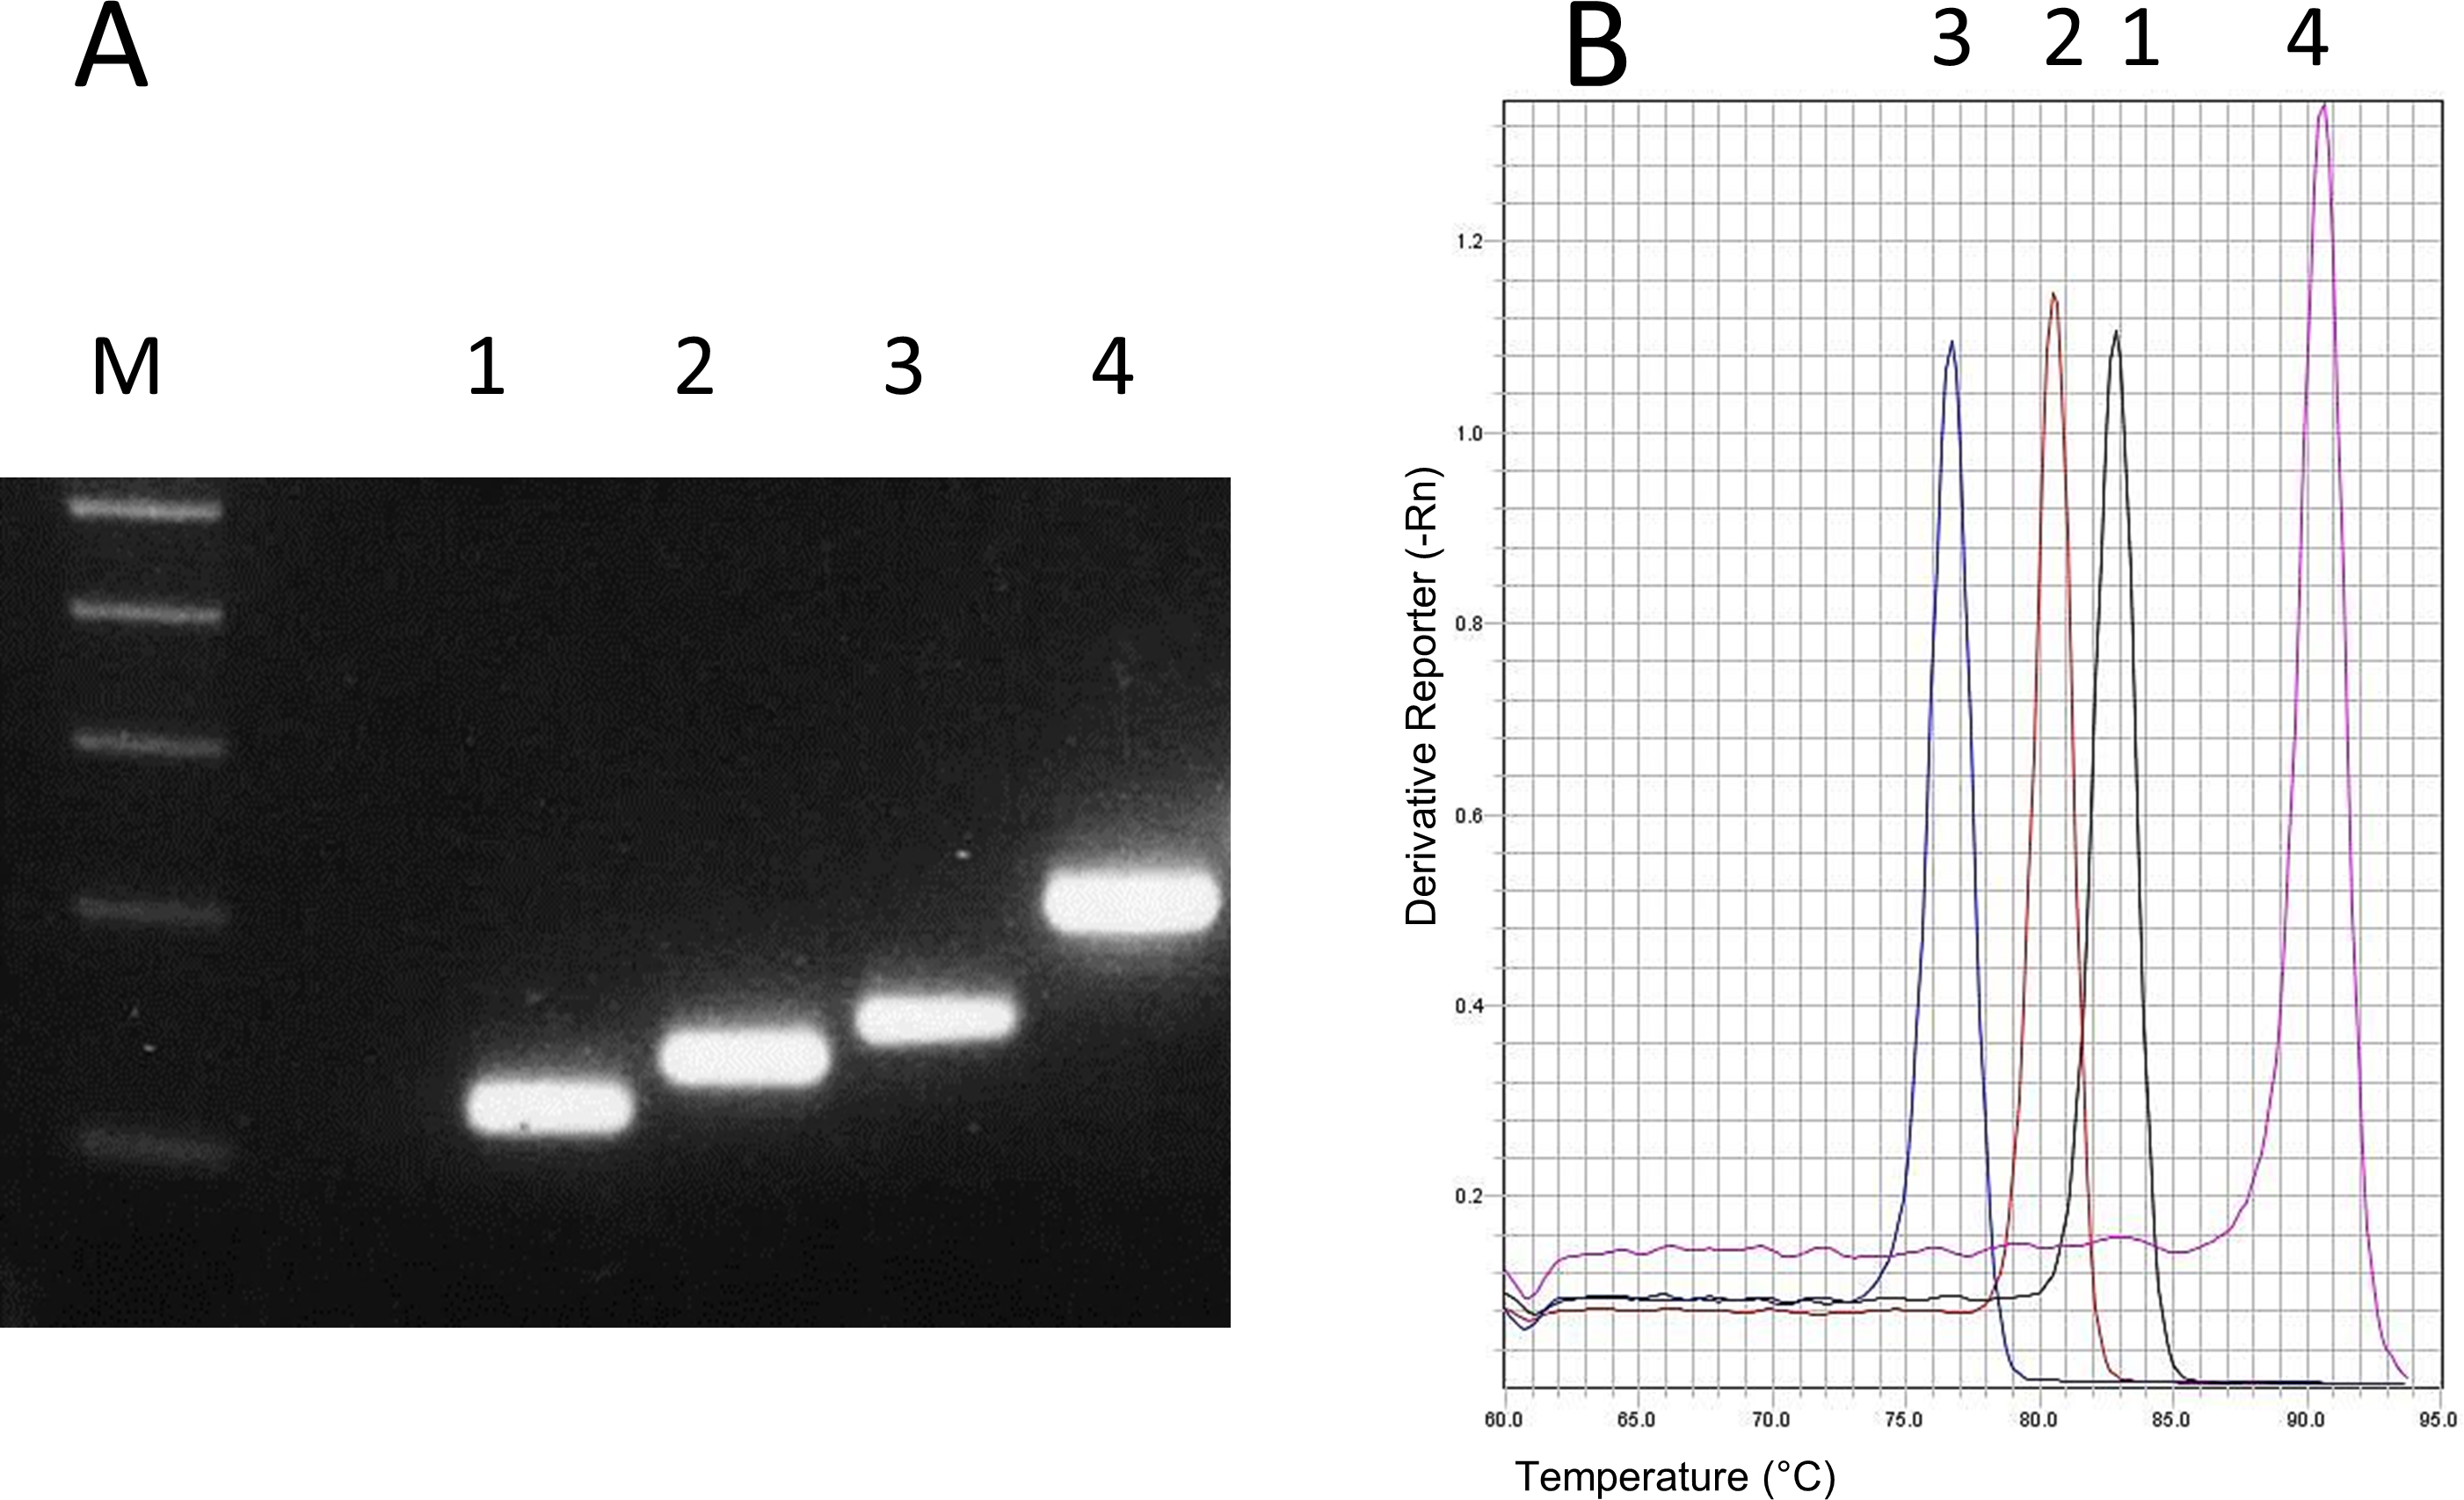
 Figure 1 of
Ryan, Mol Vis 2016; 22:1169-1175.
Figure 1 of
Ryan, Mol Vis 2016; 22:1169-1175.