Figure 3. Evaluation of EPOR expression in the retina with immunohistochemistry. A: Representative micrographs of retinal sections obtained from each group stained with antierythropoietin receptor (EPOR)
antibody. B: EPOR expression (green, amplified images in yellow boxes) was observed in the GCL and colocalized with RNA-binding protein
with multiple splicing (Rbpms; red, in the GCL, amplified images in yellow boxes). C: Rbpms and 4’-6-diamidino-2-phenylindole (DAPI; blue, in the GCL, amplified images in yellow boxes). D: Merged images (in the GCL, amplified images in yellow boxes) of the EPOR. Control = sham-operated animal; ONC = optic nerve
crush animal; ALA-ONC = alpha lipoic acid (ALA) animal pretreated 1 day before ONC; ONC-ALA = ALA-treated animal 1 day after
ONC. Scale bar = 50 µm. GCL, ganglion cell layer; INL, inner nuclear layer; ONL, outer nuclear layer.
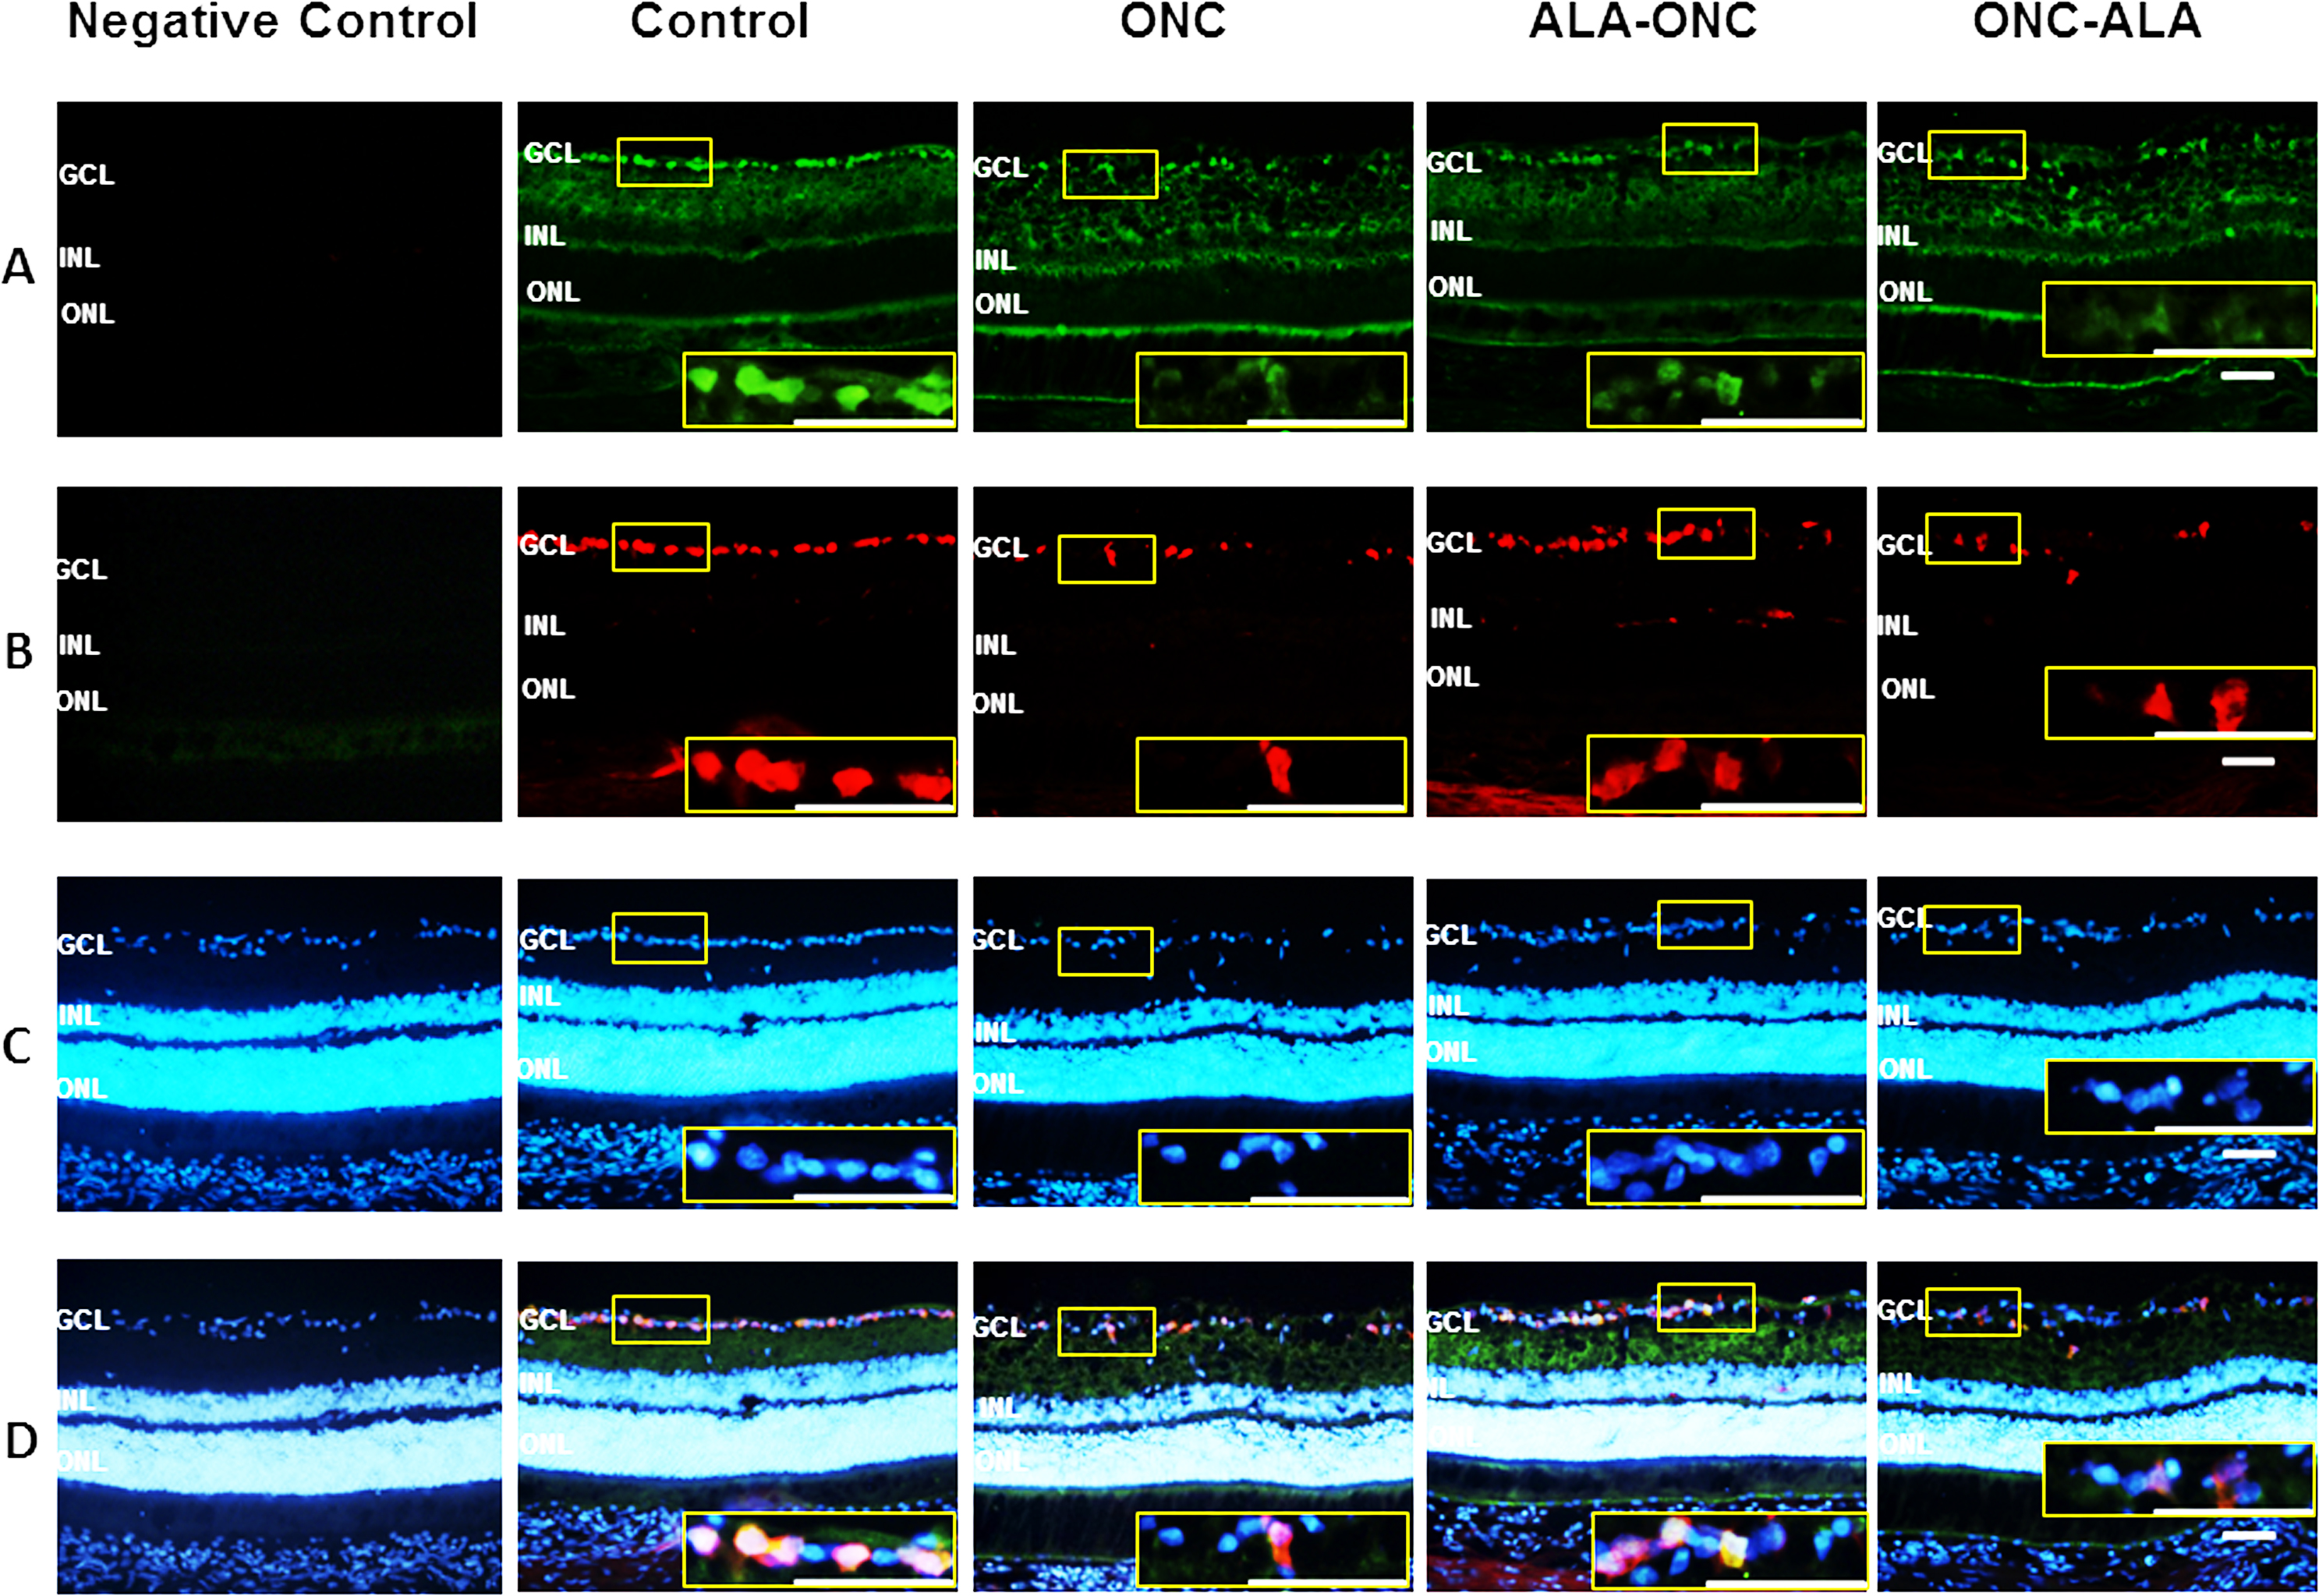
 Figure 3 of
Liu, Mol Vis 2016; 22:1122-1136.
Figure 3 of
Liu, Mol Vis 2016; 22:1122-1136.