Figure 1. Density distribution of retinal ganglion cells (RGCs) in whole mount retinas under different conditions. Panels A to D (25× magnification, amplified images in white boxes) reveal the retinal distribution patterns of RNA-binding protein with
multiple splicing (Rbpms)-positive cells under different experimental conditions. The retinal orientation (clockwise) is temporal,
inferior, nasal, and superior poles. Sampling location: 1.5 mm temporal to the optic disc. Scale bar = 800 μm. Panels E to H (100× magnification) show magnified micrographs of Rbpms-positive cells (white dashed lines encircle areas from panels A–D). Sampling field size: 877 × 660 μm2. Scale bar = 100 μm. Panels I through L (200× magnification) exhibit retinal micrographs from panels E to H (white dashed lines encircle the areas). Sampling field size: 439 × 330 μm2. Scale bar = 50 μm. Panels M to P (400× magnification) are magnified micrographs of Rbpms-positive cells (white dashed lines encircle areas from panels I–L). Sampling field size: 219×165 μm2. Scale bar = 20 um. A–D: 2.5× objective lens; E–H: 10× objective lens; I–L: 20× objective lens; M–P: 40× objective lens. AEIM = Control (sham-operated animal); BFJN = ONC (optic nerve crush animal); CGKO = ALA-ONC (ALA-pretreated
animal 1 day before ONC); DHLP = ONC-ALA (ALA-treated animal 1 day after ONC).
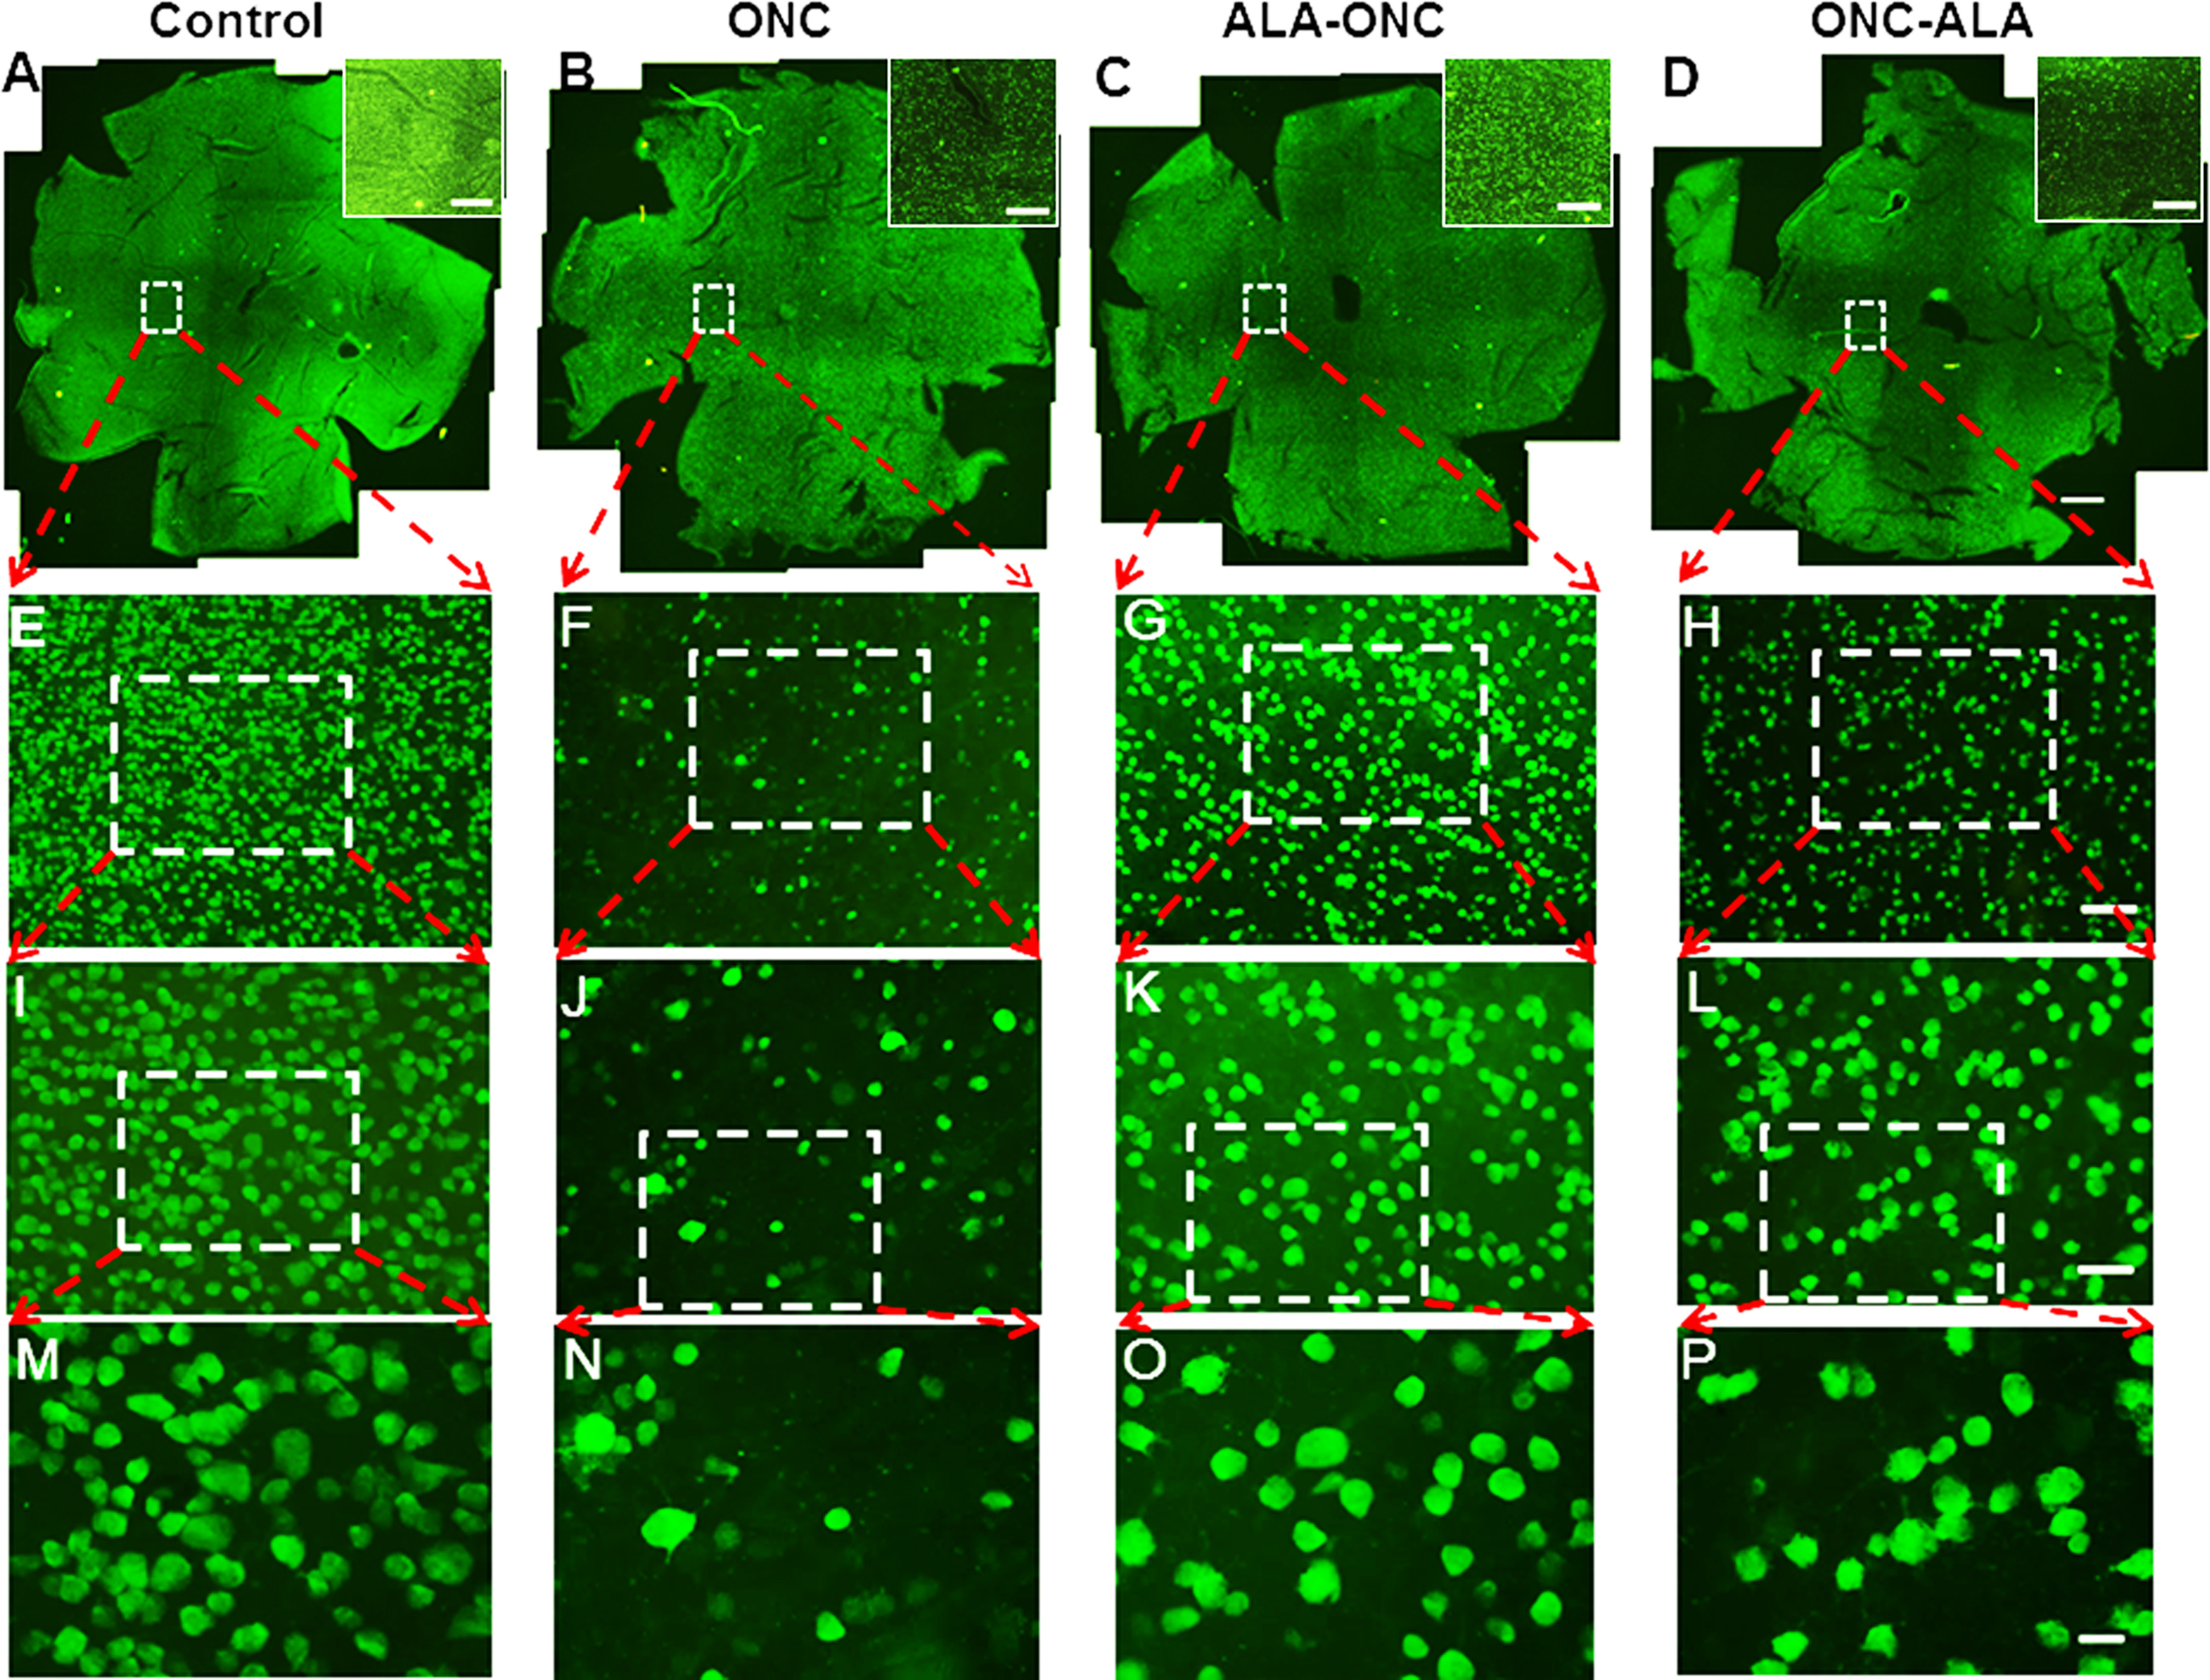
 Figure 1 of
Liu, Mol Vis 2016; 22:1122-1136.
Figure 1 of
Liu, Mol Vis 2016; 22:1122-1136.