Figure 4. Infiltration of microglia and macrophages in the WT and p27 KO retinas after MNU treatment. A: Double immunofluorescence for Iba1 and rhodopsin (Rho) reveals infiltration of microglia and macrophages into the outer
nuclear layer (ONL) after photoreceptor damage. INL, inner nuclear layer; GCL, ganglion cell layer. Scale bar = 20 μm. B: Z-stack images of Iba1 staining in the whole mount retinas at day 3 after N-methyl-N-nitrosourea (MNU) treatment showing
infiltration of microglia and macrophages in the ONL. Scale bar = 20 μm. C: Quantitative real-time (RT)–PCR analysis of microglia-specific genes in the wild-type (WT) and knockout (KO) retinas at
day 3 after MNU treatment. The transcript levels of each gene are expressed relative to the WT retinas after normalization
to Tbp levels. Each bar represents the mean ± standard error of the mean (SEM; n = 3). No significant difference was observed between
the WT and KO retinas.
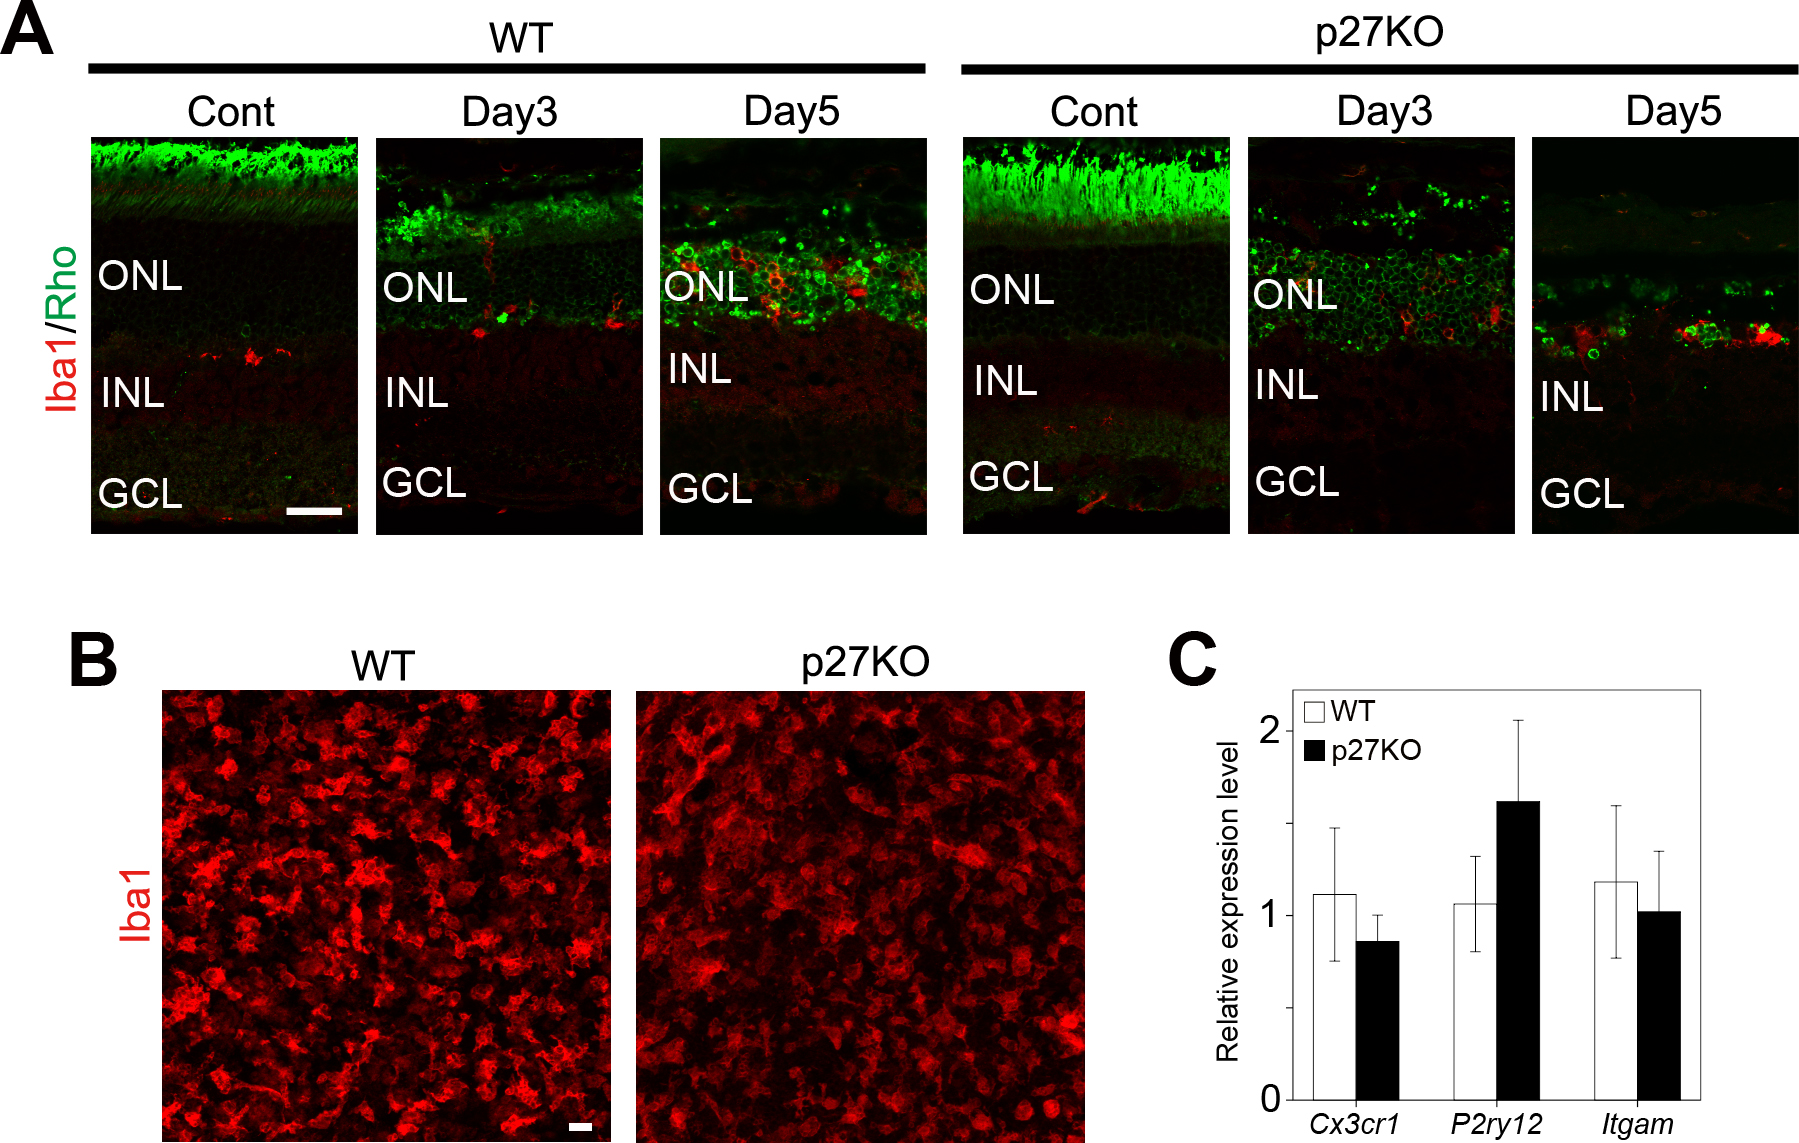
 Figure 4 of
ul Quraish, Mol Vis 2016; 22:1103-1121.
Figure 4 of
ul Quraish, Mol Vis 2016; 22:1103-1121.