Figure 4 of
Diego, Mol Vis 2016; 22:1095-1102.
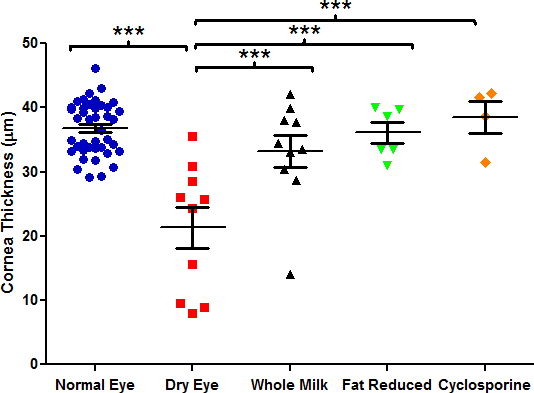
Figure 4.
Corneal epithelial thickness after treatment with human milk therapies. Comparisons were analyzed with one-way ANOVA with Tukey’s post-hoc test. *p<0.05, **p<0.01, ***p<0.001; data are mean ± standard error of the mean (SEM).
 Figure 4 of
Diego, Mol Vis 2016; 22:1095-1102.
Figure 4 of
Diego, Mol Vis 2016; 22:1095-1102.