Figure 9. A comparison of in vitro and in vivo rod photoreceptor differentiation. D25, D28, and D35 represent the days in culture for the retinal organoids, and P2–10 correspond
to the postnatal day mouse retina. A: The principal component analysis (PCA) plot shows the transcriptome data for purified rods from the Nrl-GFP organoid culture and from the mouse retina. PC1 (on the x-axis) shows that the largest component of the variance in the
expression data (31.2%) is due to the developmental time. B: The heatmap shows the expression of the photoreceptor genes in the developing rods from the organoid culture and the mouse
retina.
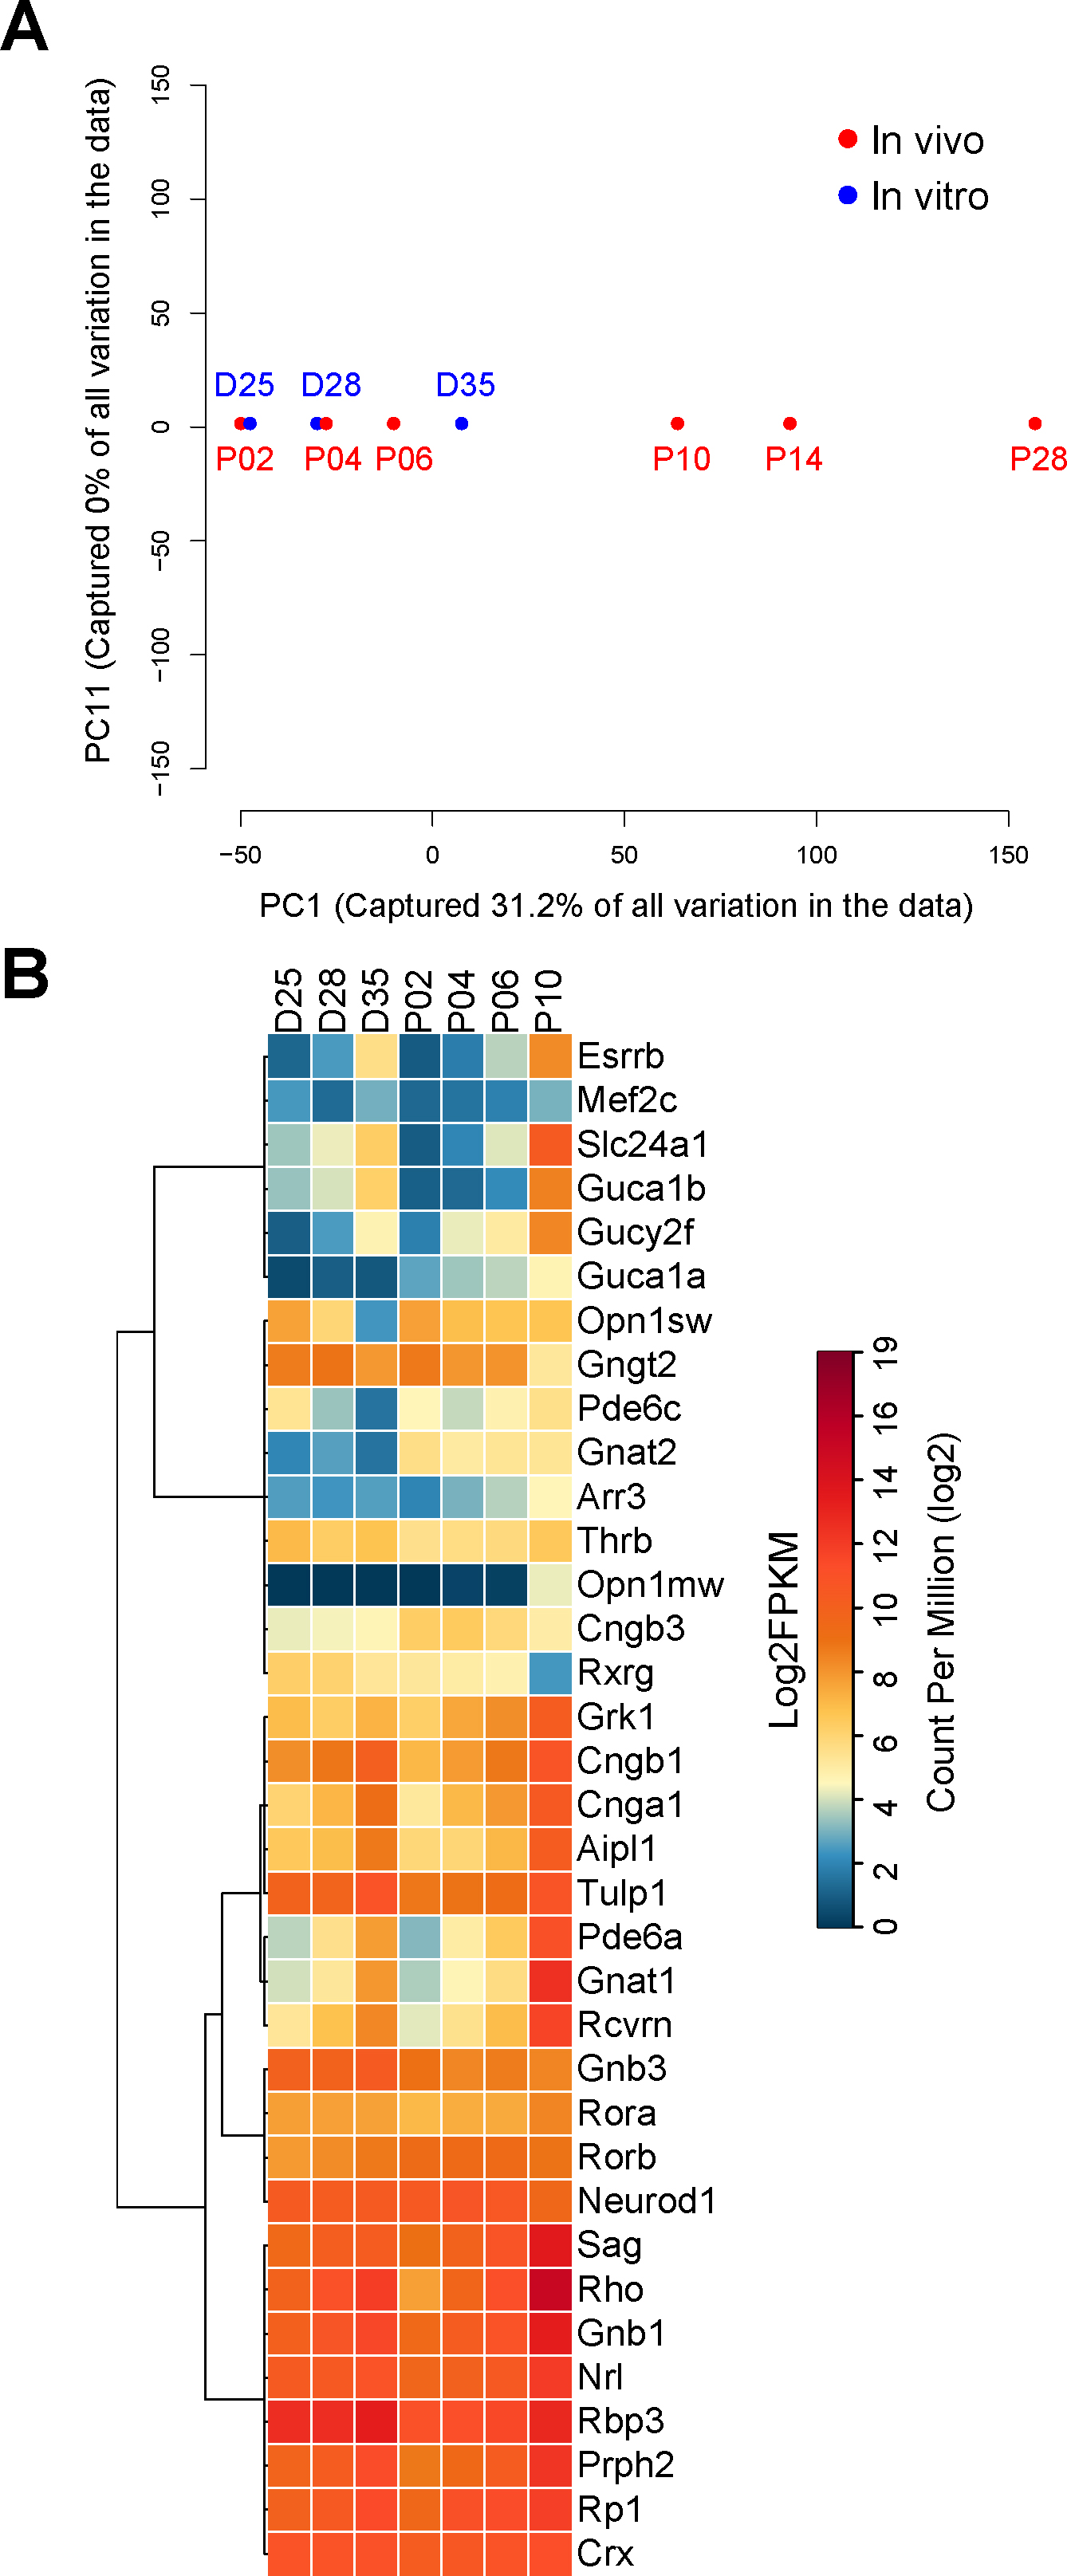
 Figure 9 of
Chen, Mol Vis 2016; 22:1077-1094.
Figure 9 of
Chen, Mol Vis 2016; 22:1077-1094.