Figure 6. Generation of rod photoreceptors in Nrl-GFP mouse retinal organoids. A: Time course of Nrl and rhodopsin (Rho) expression during organoid differentiation with reverse transcription PCR (RT–PCR). Total RNA was made from 20 dissected
neural retinas. Gapdh expression was used as the control. B: Dot plots of flow analysis of GFP+ cells during organoid differentiation. Gating of GFP+ cells was based on wild-type retinal
organoids without green fluorescent protein (GFP) at the same differentiation day. C: The bar chart shows the percentage of GFP+ cells (rods) in the total cell population. No significant differences were observed
in the percentage of GFP+ cells from embryonic pluripotent stem cells (ESCs) or induced pluripotent stem cells (iPSCs)–derived
retinal organoids. The data are represented as mean ± standard error of the mean (SEM) and were obtained from four independent
experiments each from ESC and iPSC organoids (n = 4). Each experimental time point included 30–60 organoids. *p<0.05. D: GFP (green) expression in retinal organoids at different stages of differentiation. No significant morphological differences
were observed among the neural retinas differentiated from ESCs or iPSCs; representative figures are shown. AP and BA show
the apical and basal sides of the organoid, respectively. Scale bar = 100 μm.
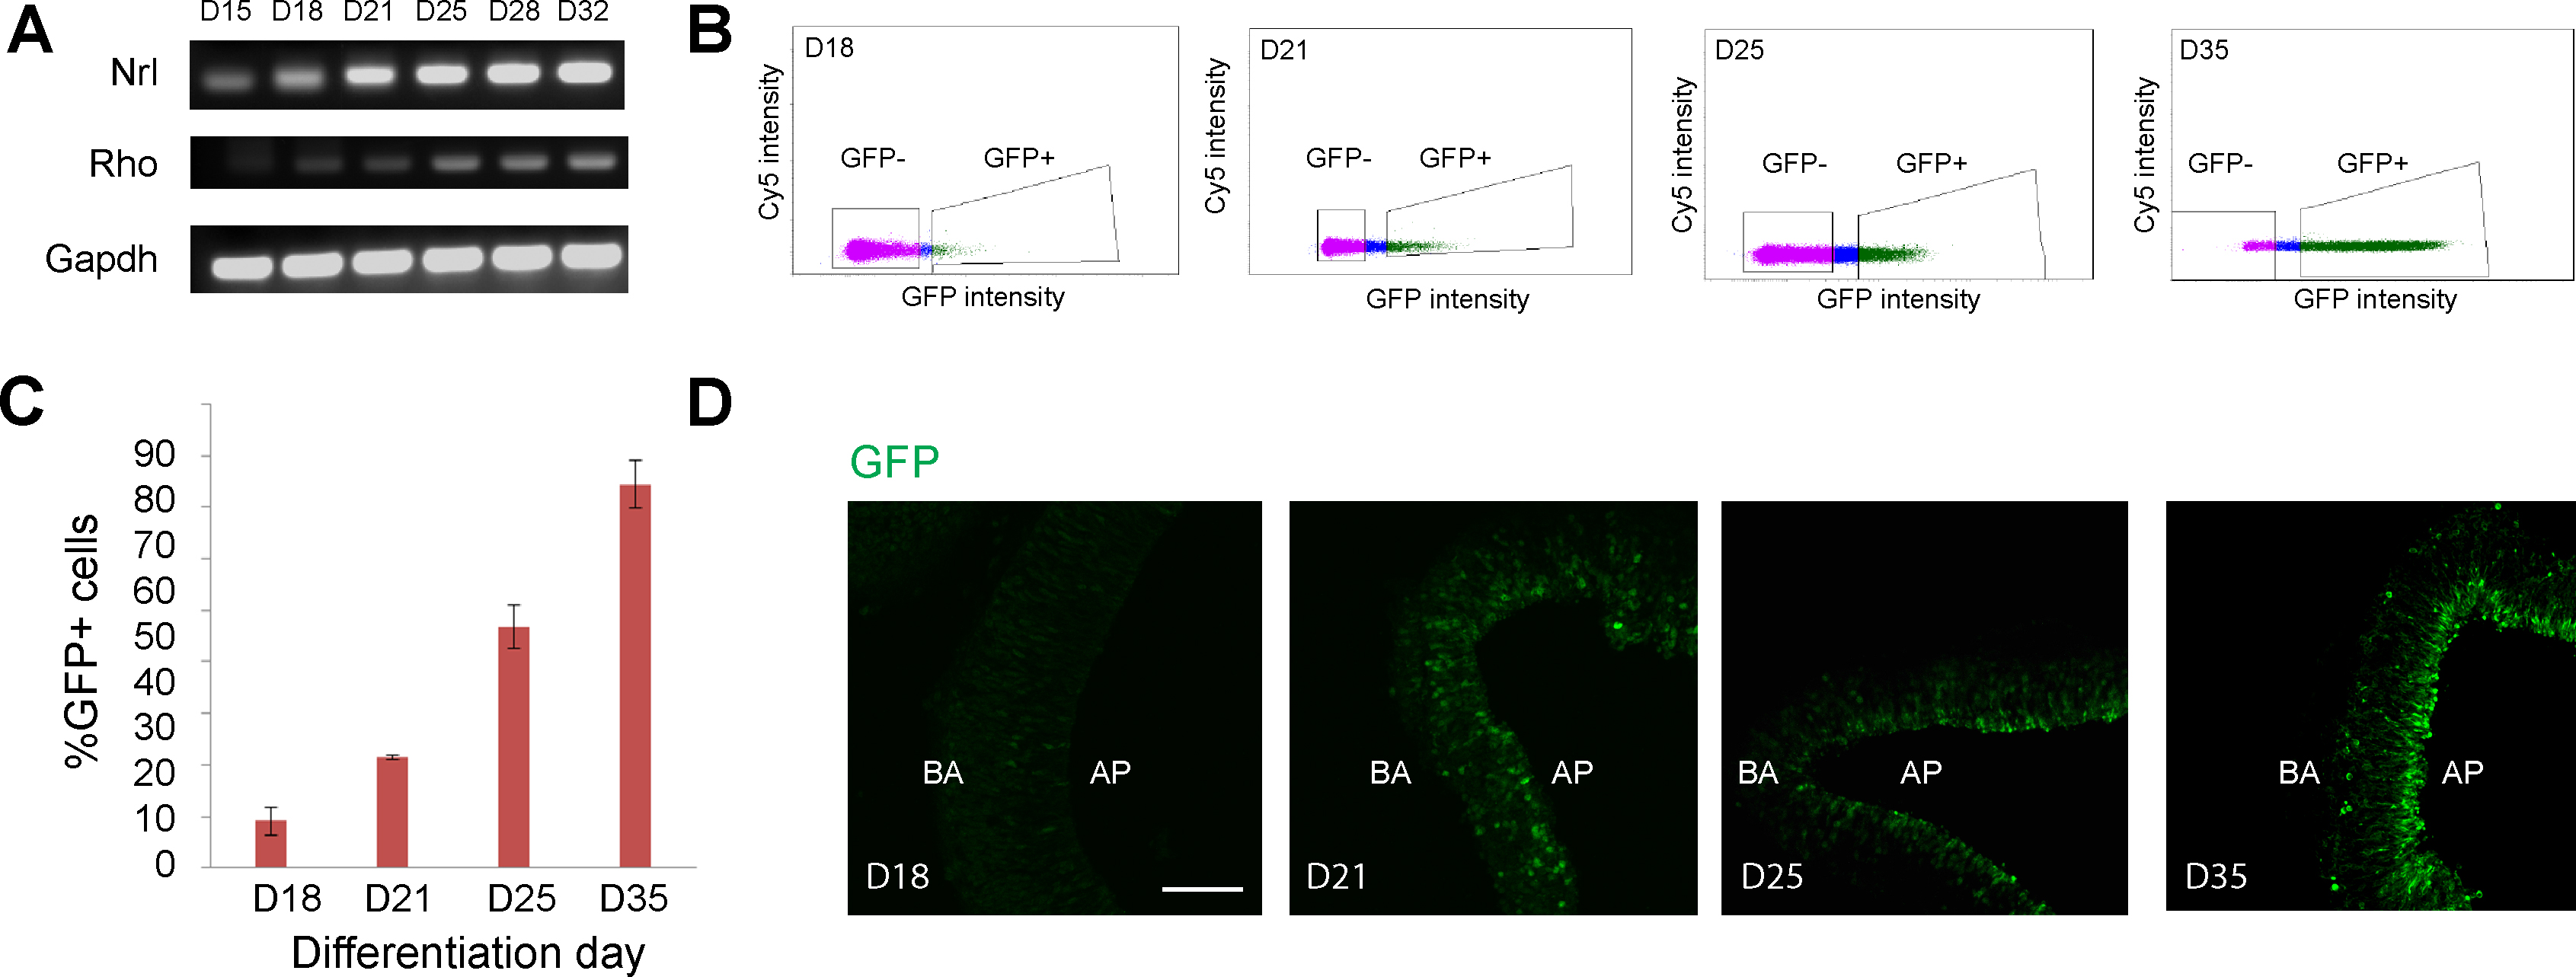
 Figure 6 of
Chen, Mol Vis 2016; 22:1077-1094.
Figure 6 of
Chen, Mol Vis 2016; 22:1077-1094.