Figure 1. Distribution of risk scores. Distribution of (A) bilateral Grade 5 cases and (B) bilateral Grade 1 controls, showing the mean genetic risk score (solid line) and ±1 standard deviation (dashed lines). Sequenced
individuals are shown with bold bars.
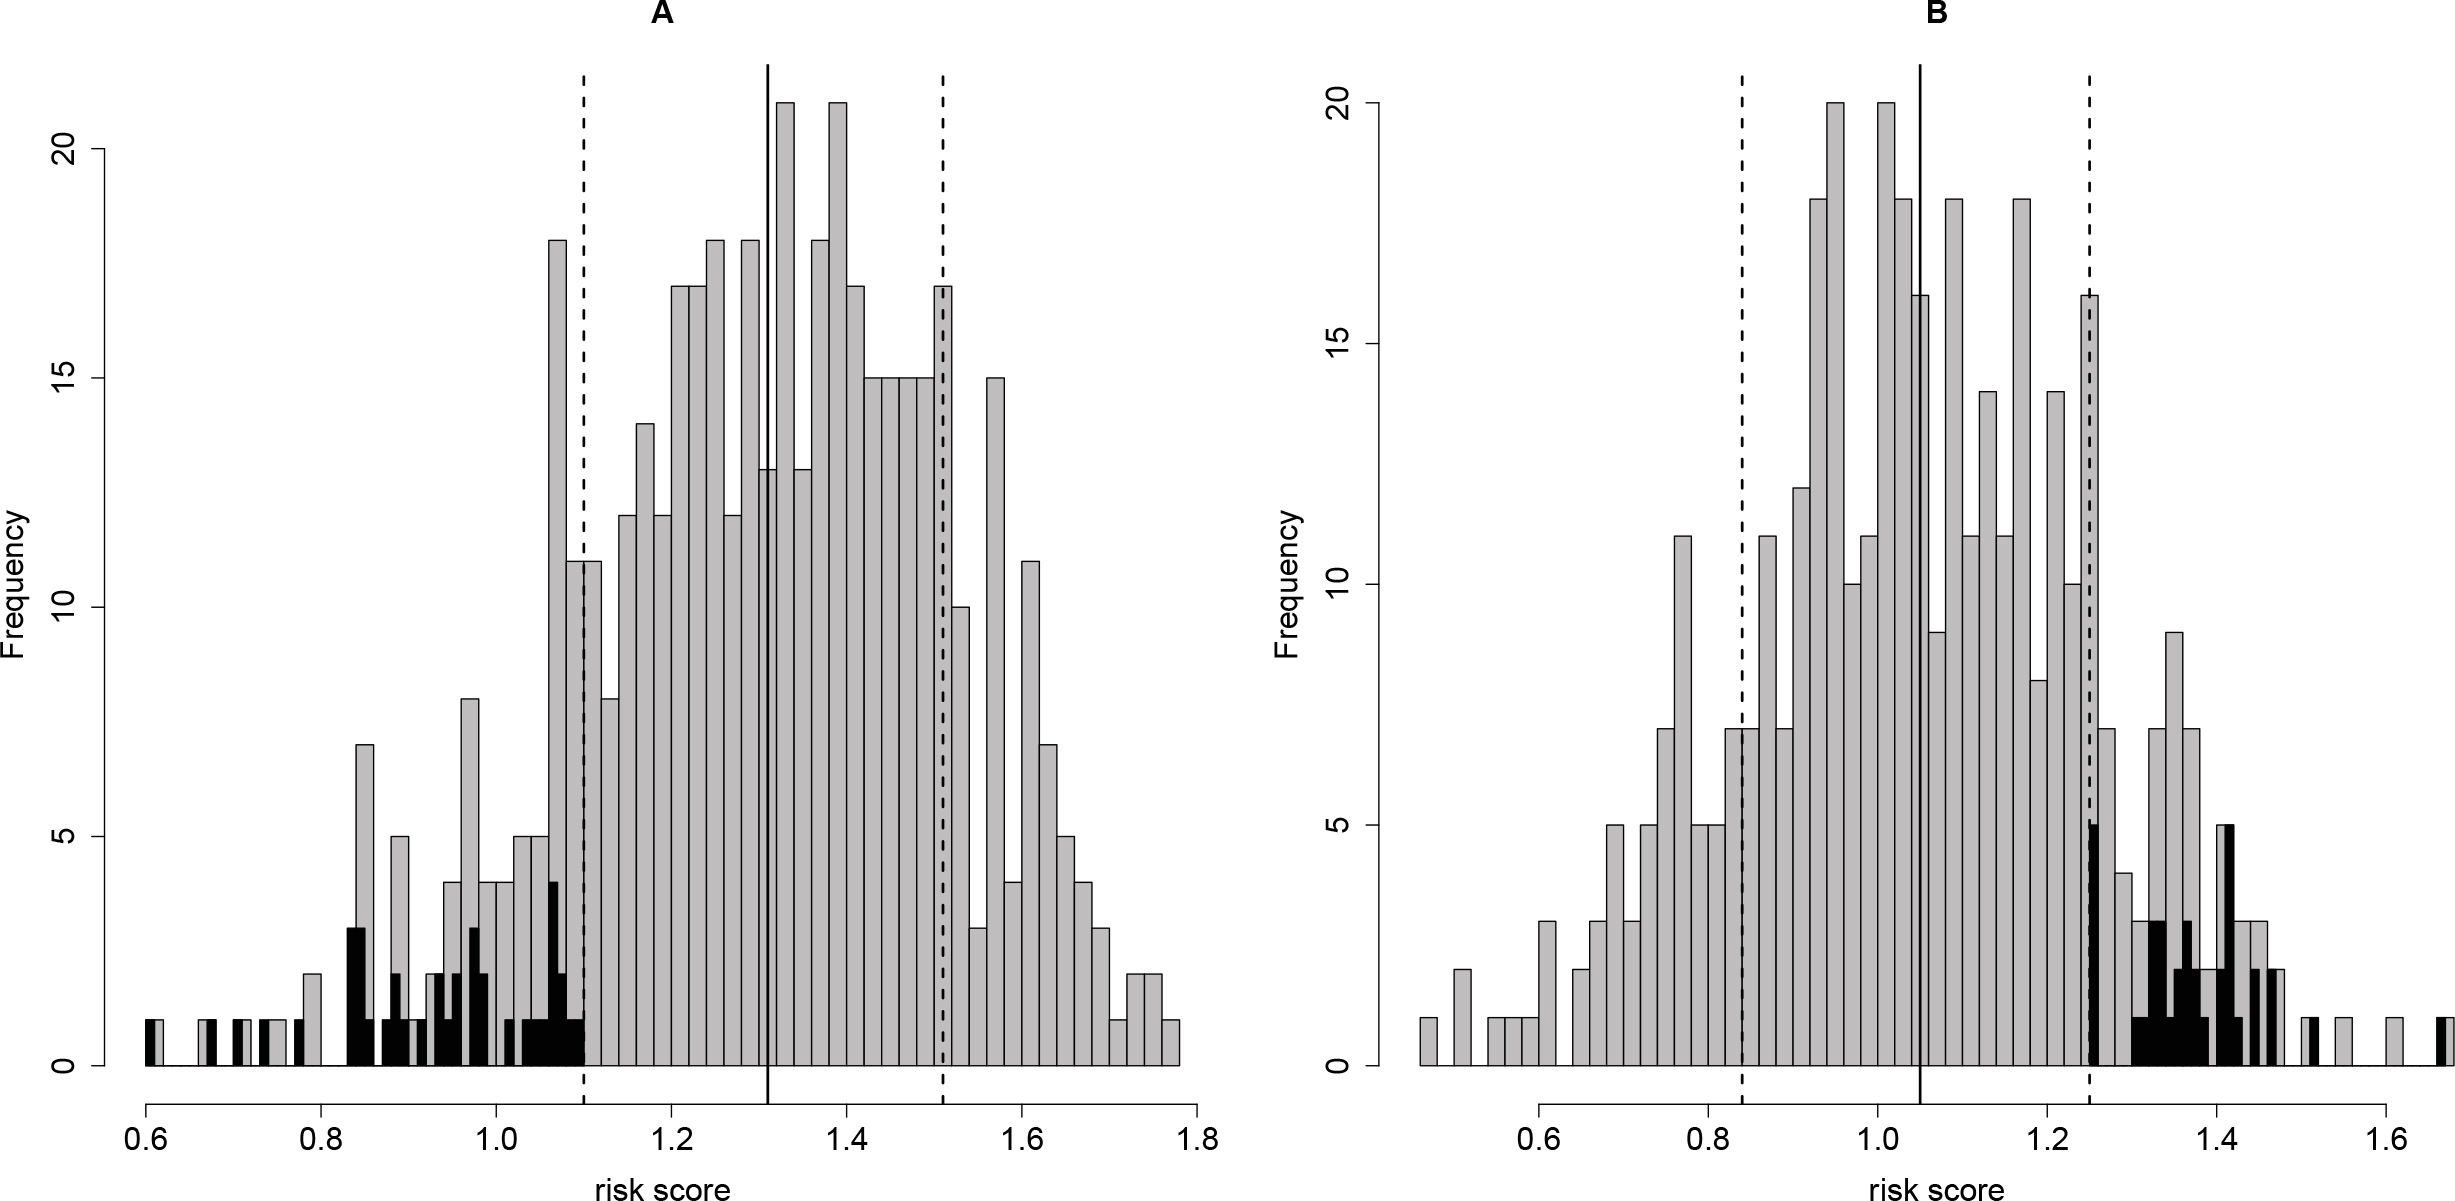
 Figure 1 of
Sardell, Mol Vis 2016; 22:1062-1076.
Figure 1 of
Sardell, Mol Vis 2016; 22:1062-1076.