Figure 1. Transduction of rAAV-hSyn-GFP and rAAV-hSyn-Brn3b and overexpression of Brn3b in RGCs of Brown Norway rats. A: Immunohistochemical analyses for green fluorescent protein (GFP; green) in frozen retinal sections from rats injected with
the recombinant adenoassociated virus–hSyn–green fluorescent protein (rAAV-hSyn-GFP) virus. Binding of the GFP antibody was
detected using an Alexa 488-conjugated donkey anti-rabbit immunoglobulin G (IgG) antibody. Cells were counterstained with
4',6-diamidino-2-phenylindole (DAPI) to detect nuclei. B: Brn3b (pseudogreen) and βIII-tubulin (pseudored) immunostaining in retinal frozen sections from rats intravitreally injected
with either rAAV-hSyn-GFP or rAAV-hSyn-Brn3b. The immunostaining was detected by using corresponding Alexa 546 (pseudogreen)
and Alexa 647 (pseudored)-conjugated donkey anti-immunoglobulin G (IgG) secondary antibodies. Cells were counterstained with
DAPI (blue) to detect cell nuclei. NFL, nerve fiber layer; GCL, ganglion cell layer; IPL, inner plexiform layer; INL, inner
nuclear layer; OPL, outer plexiform layer; ONL, outer nuclear layer; OS, outer segment. Scale bar indicates 20 µm. C: Representative images of the GCL showing Brn3b staining in rats injected with rAAV-hSyn-GFP or rAAV-hSyn-Brn3b. D: Plot of the ratio of fluorescence intensity of Brn3b immunostaining in RGCs between left (L: intravitreally injected) and
right (R: contralateral) eyes in 24 regions. The L/R ratio was compared between rats injected with rAAV-hSyn-GFP and rAAV-hSyn-Brn3b.
A significant increase in Brn3b staining in RGCs was observed in rats that overexpressed Brn3b compared to the control vector.
Fluorescent intensity values are shown as mean ± standard error of the mean (SEM), n = 6. The Mann–Whitney rank-sum test was
used for statistical analysis (*p<0.002).
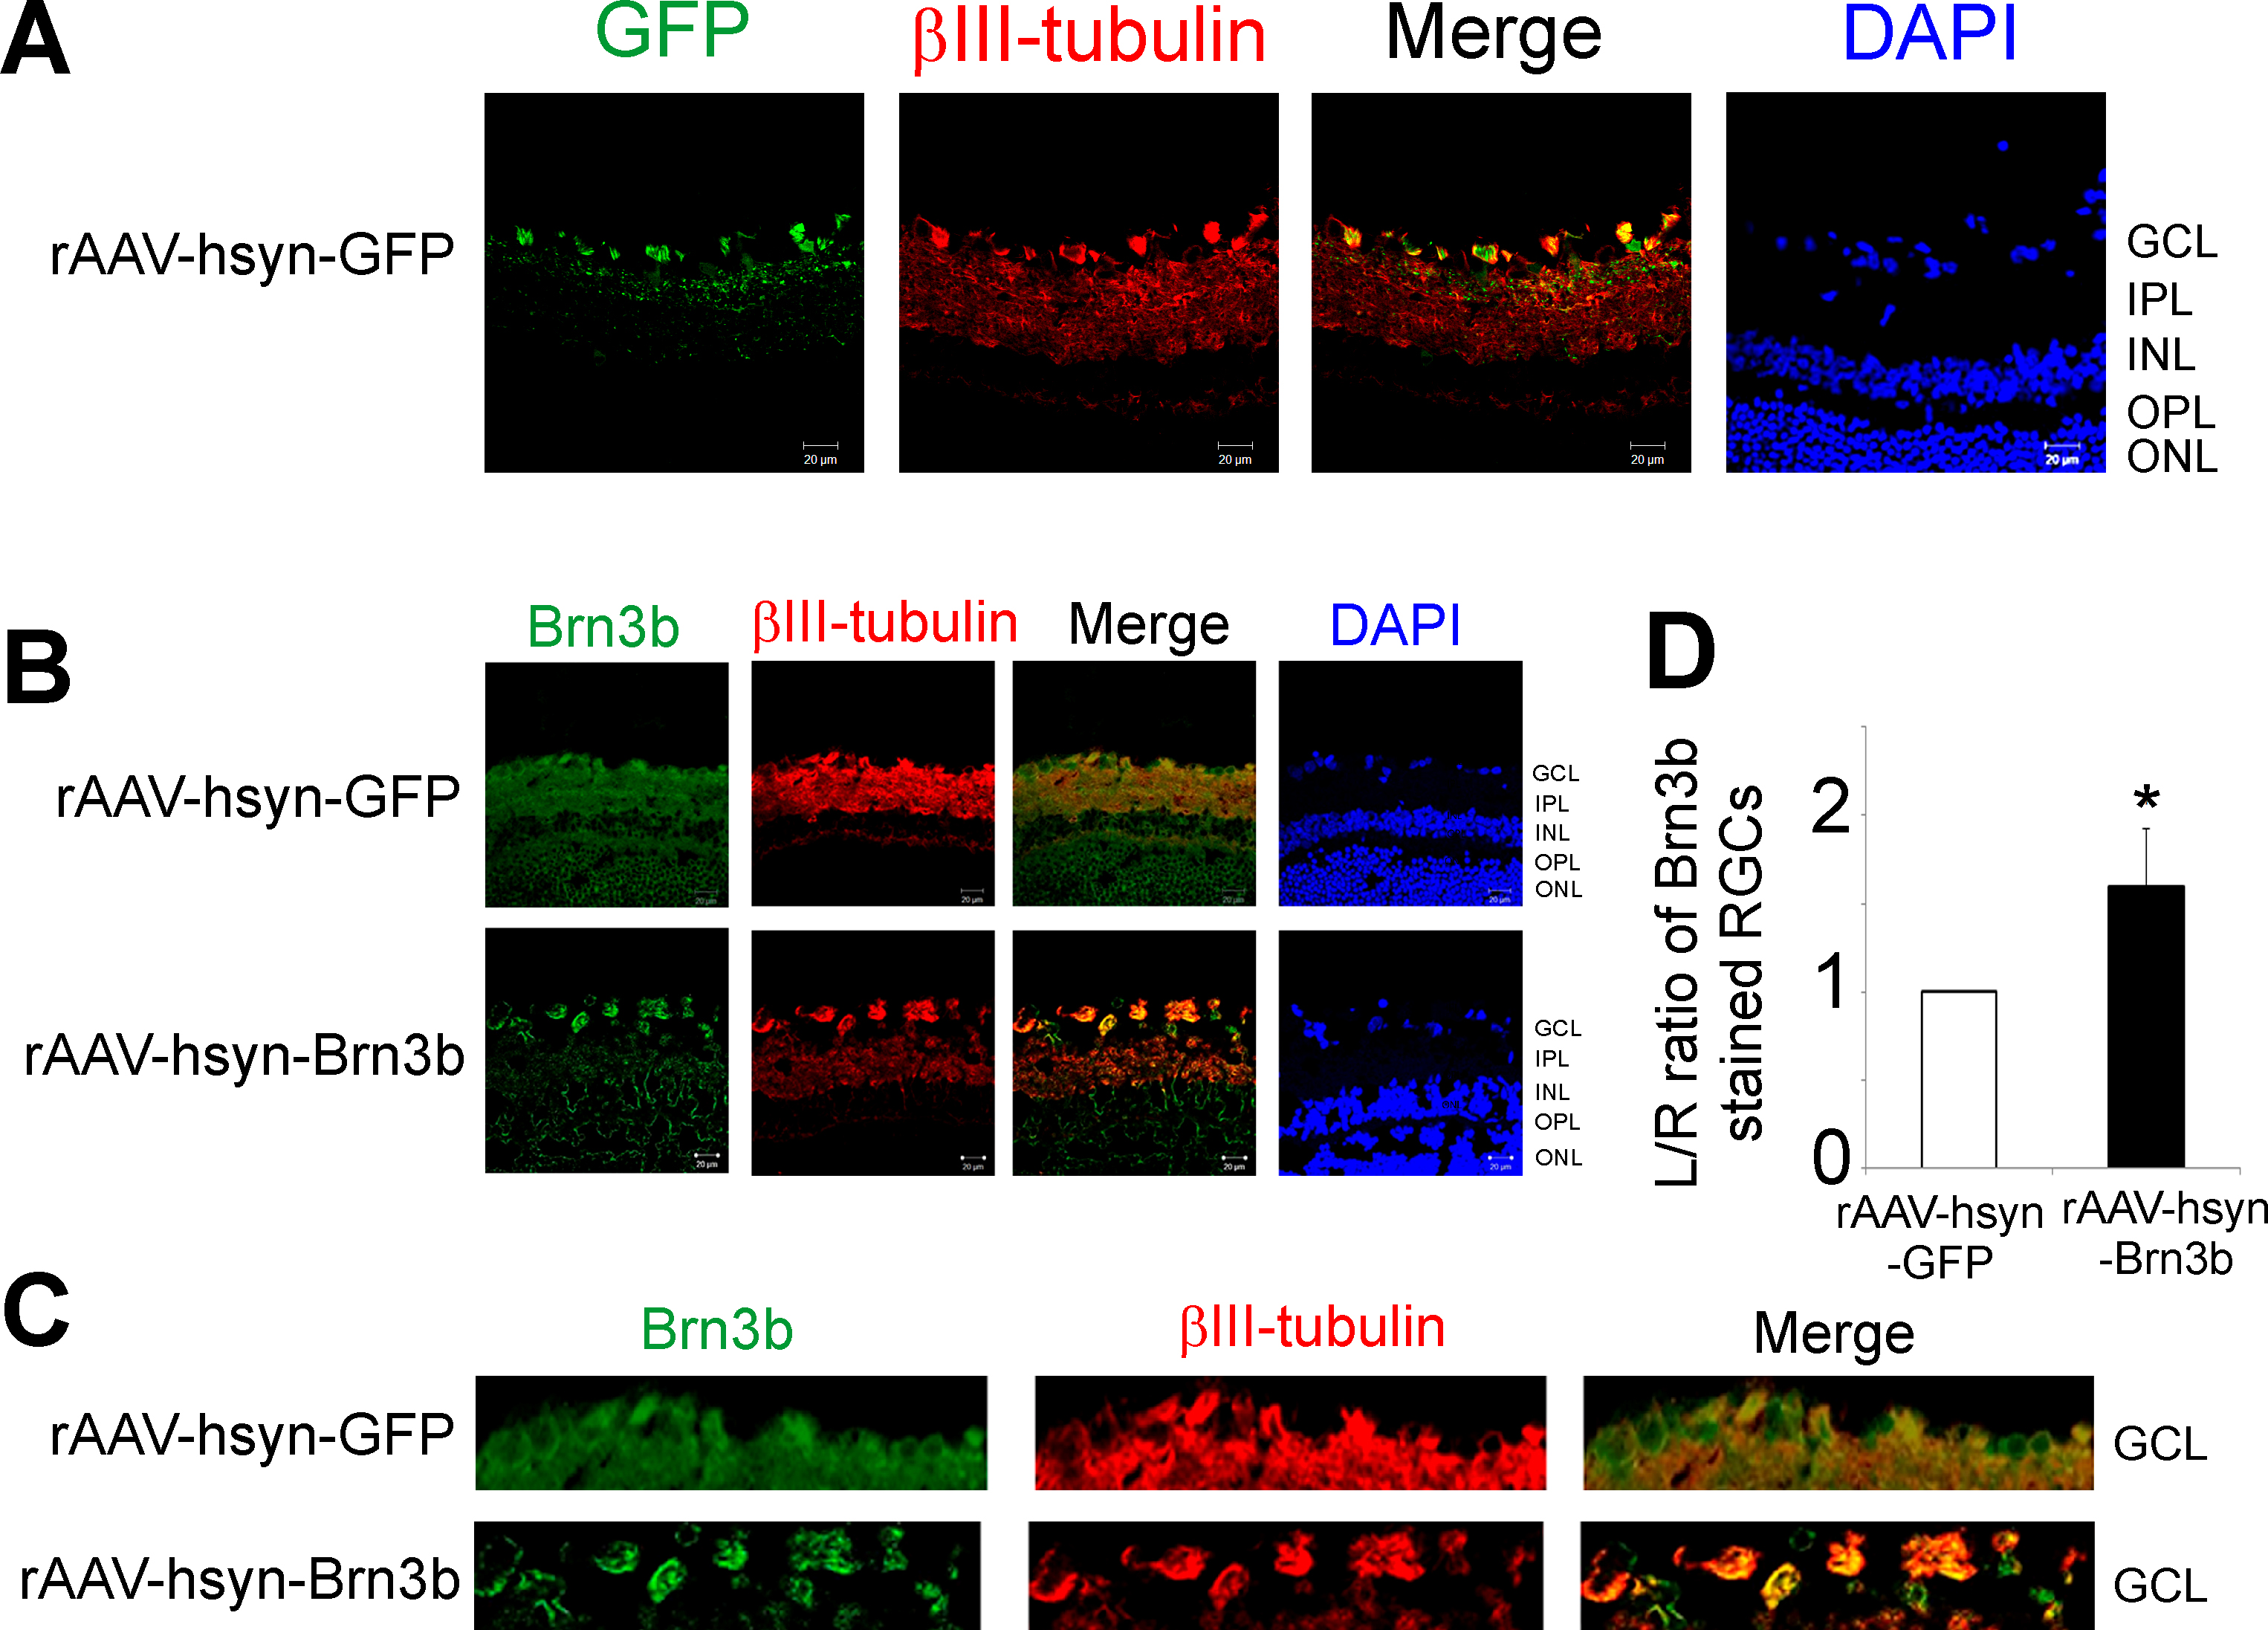
 Figure 1 of
Phatak, Mol Vis 2016; 22:1048-1061.
Figure 1 of
Phatak, Mol Vis 2016; 22:1048-1061.