Figure 2. Typical raw data obtained using the Sequenom MassArray system for T14484C mutation screening. The blue arrows above the wave
peak indicate the resulting genotypes. A: 100% wild-type mtDNA. B: 100% mutant mtDNA. C: Heteroplasmic (C/T) mtDNA.
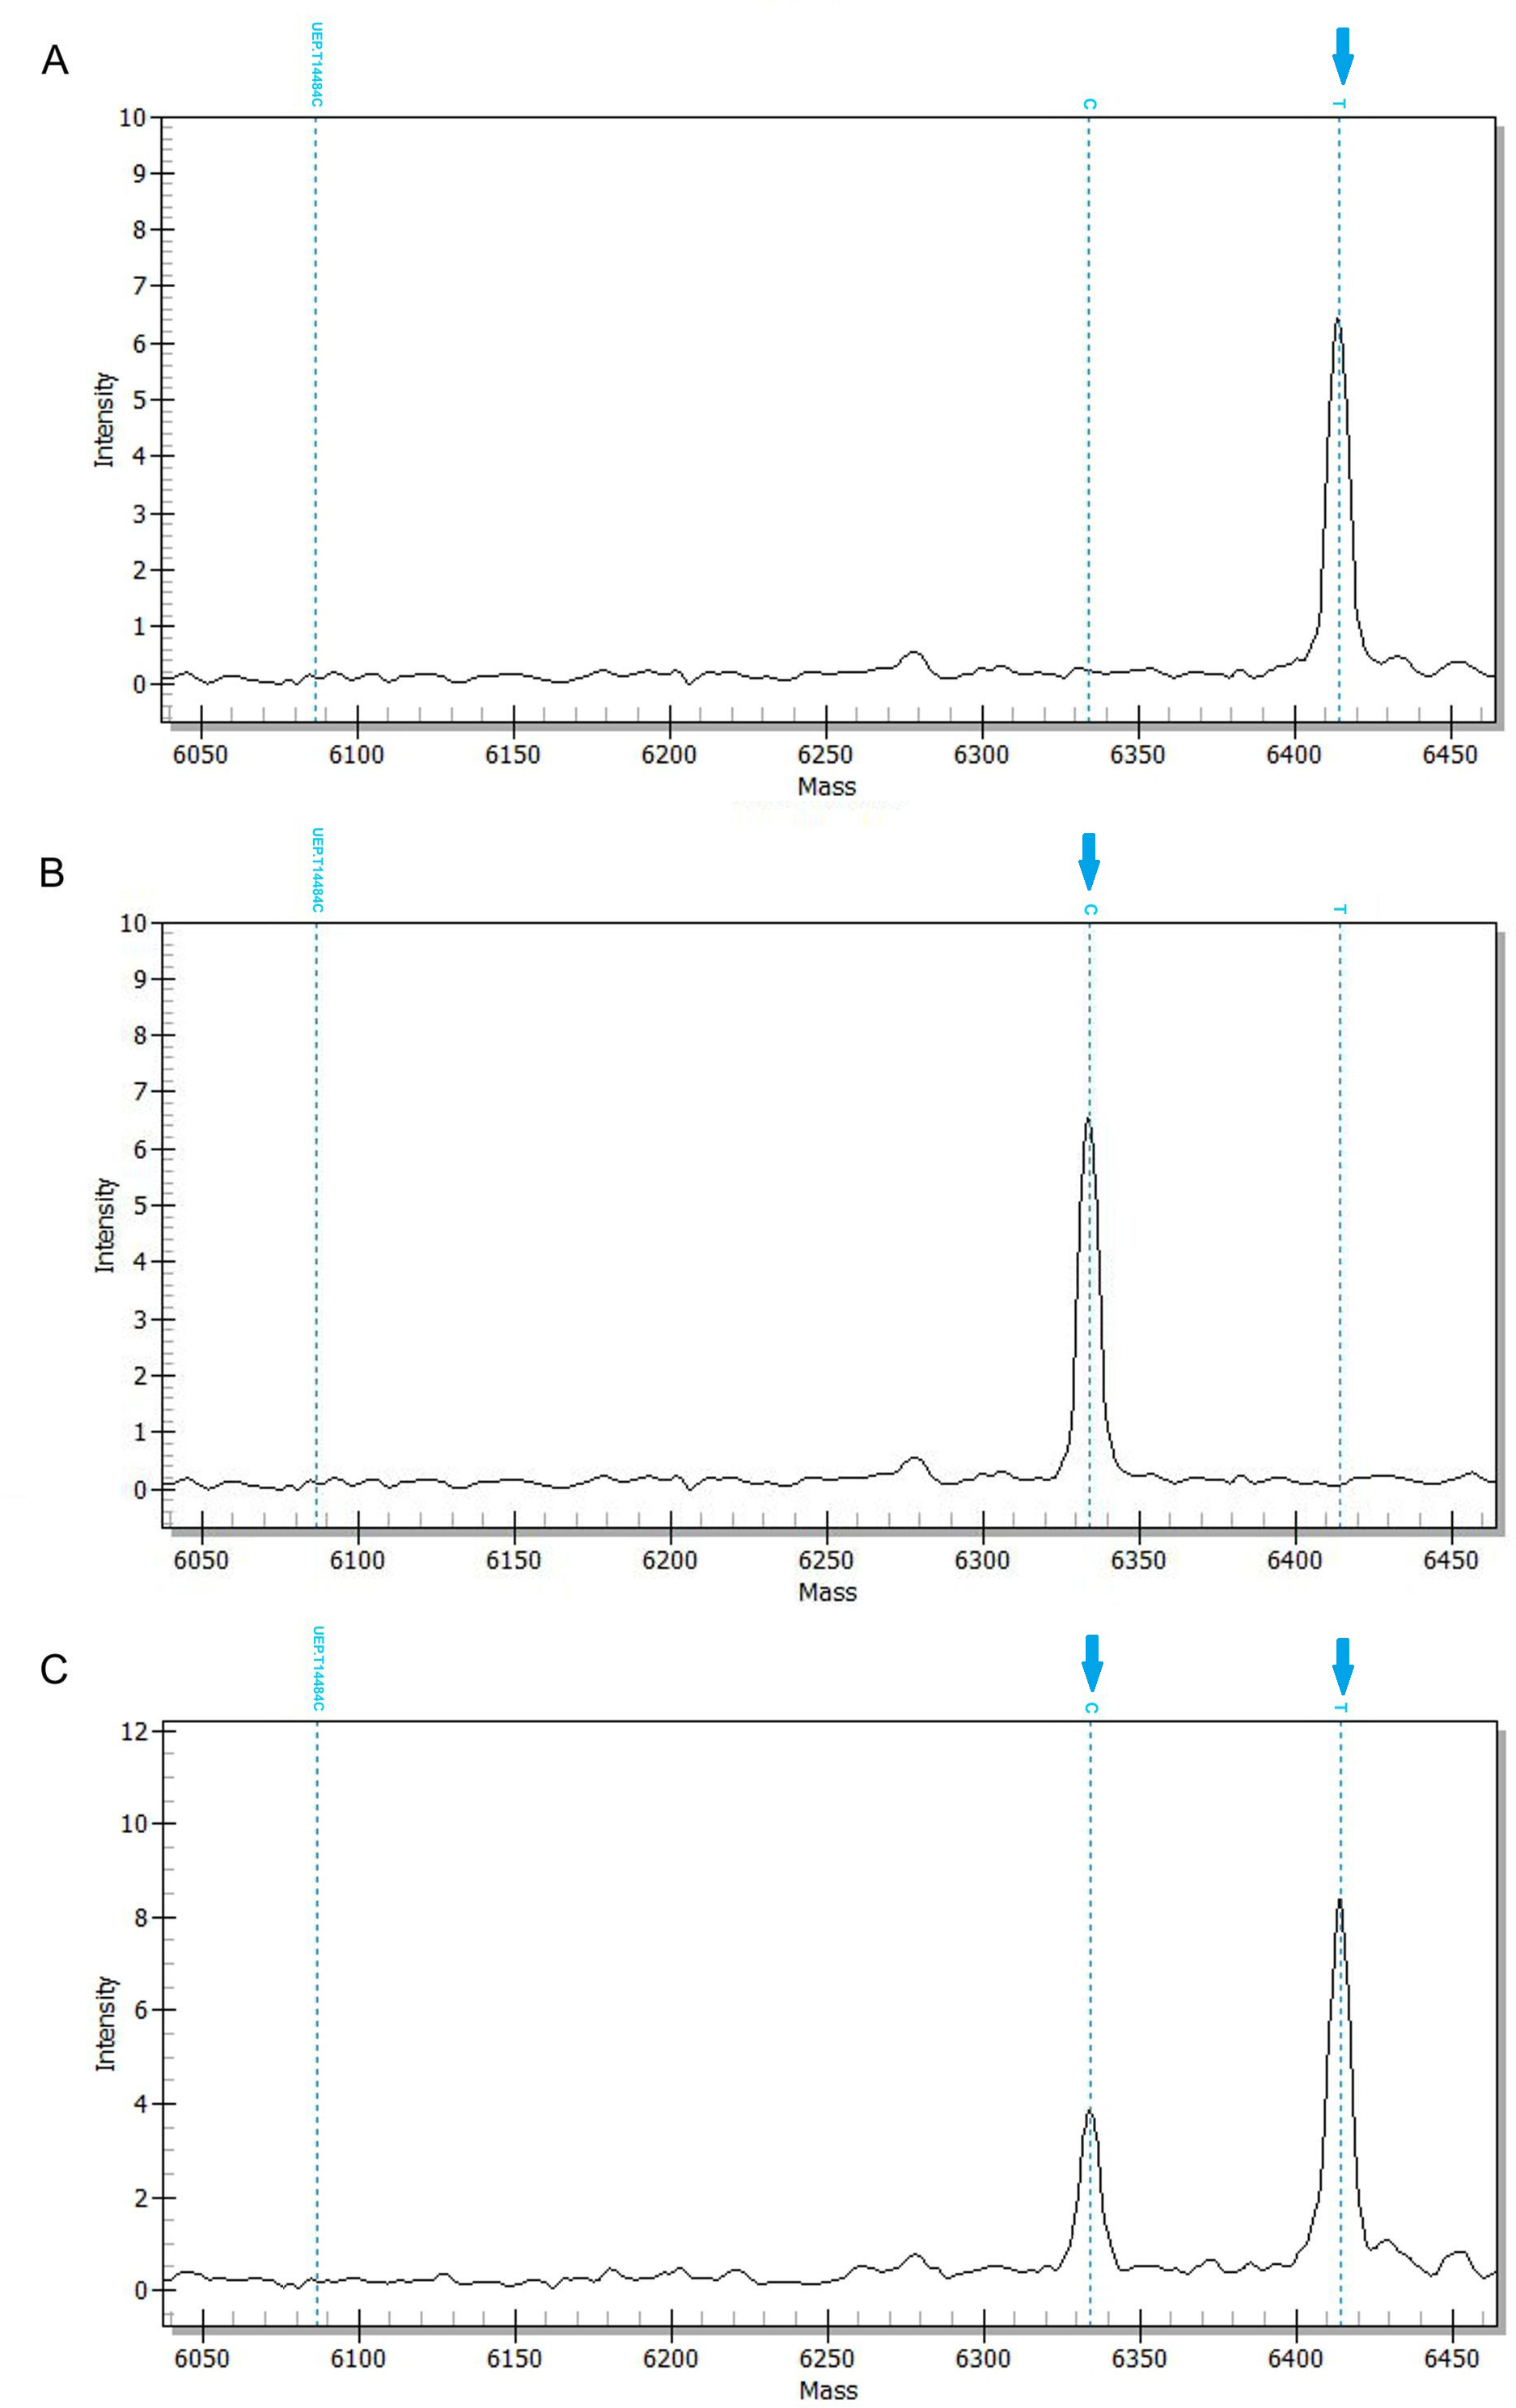
 Figure 2 of
Miranda, Mol Vis 2016; 22:1024-1035.
Figure 2 of
Miranda, Mol Vis 2016; 22:1024-1035.