Figure 1. Oxidative stress declines viability of RPE cells. A: Experimental scheme for oxidative stress induction. B: Alterations in cellular morphology of RPE cells depending on the concentration of H2O2 24 h post treatment with H2O2. C: Cell viability was evaluated with the thiazolyl blue tetrazolium bromide (MTT) assay 24 h post treatment with H2O2. The untreated control was set as 100%, and cell viability was expressed as a percentage relative to the activity of the
control group. D, E: Cell morphology and viability of RPE cells treated with H2O2 for 48 h. Scale bar: 50 μm. P values of less than 0.05 were considered statistically significant (*p<0.05, **p<0.01, ***p<0.001).
The data are expressed as the mean ± standard deviation (SD) of three independent experiments.
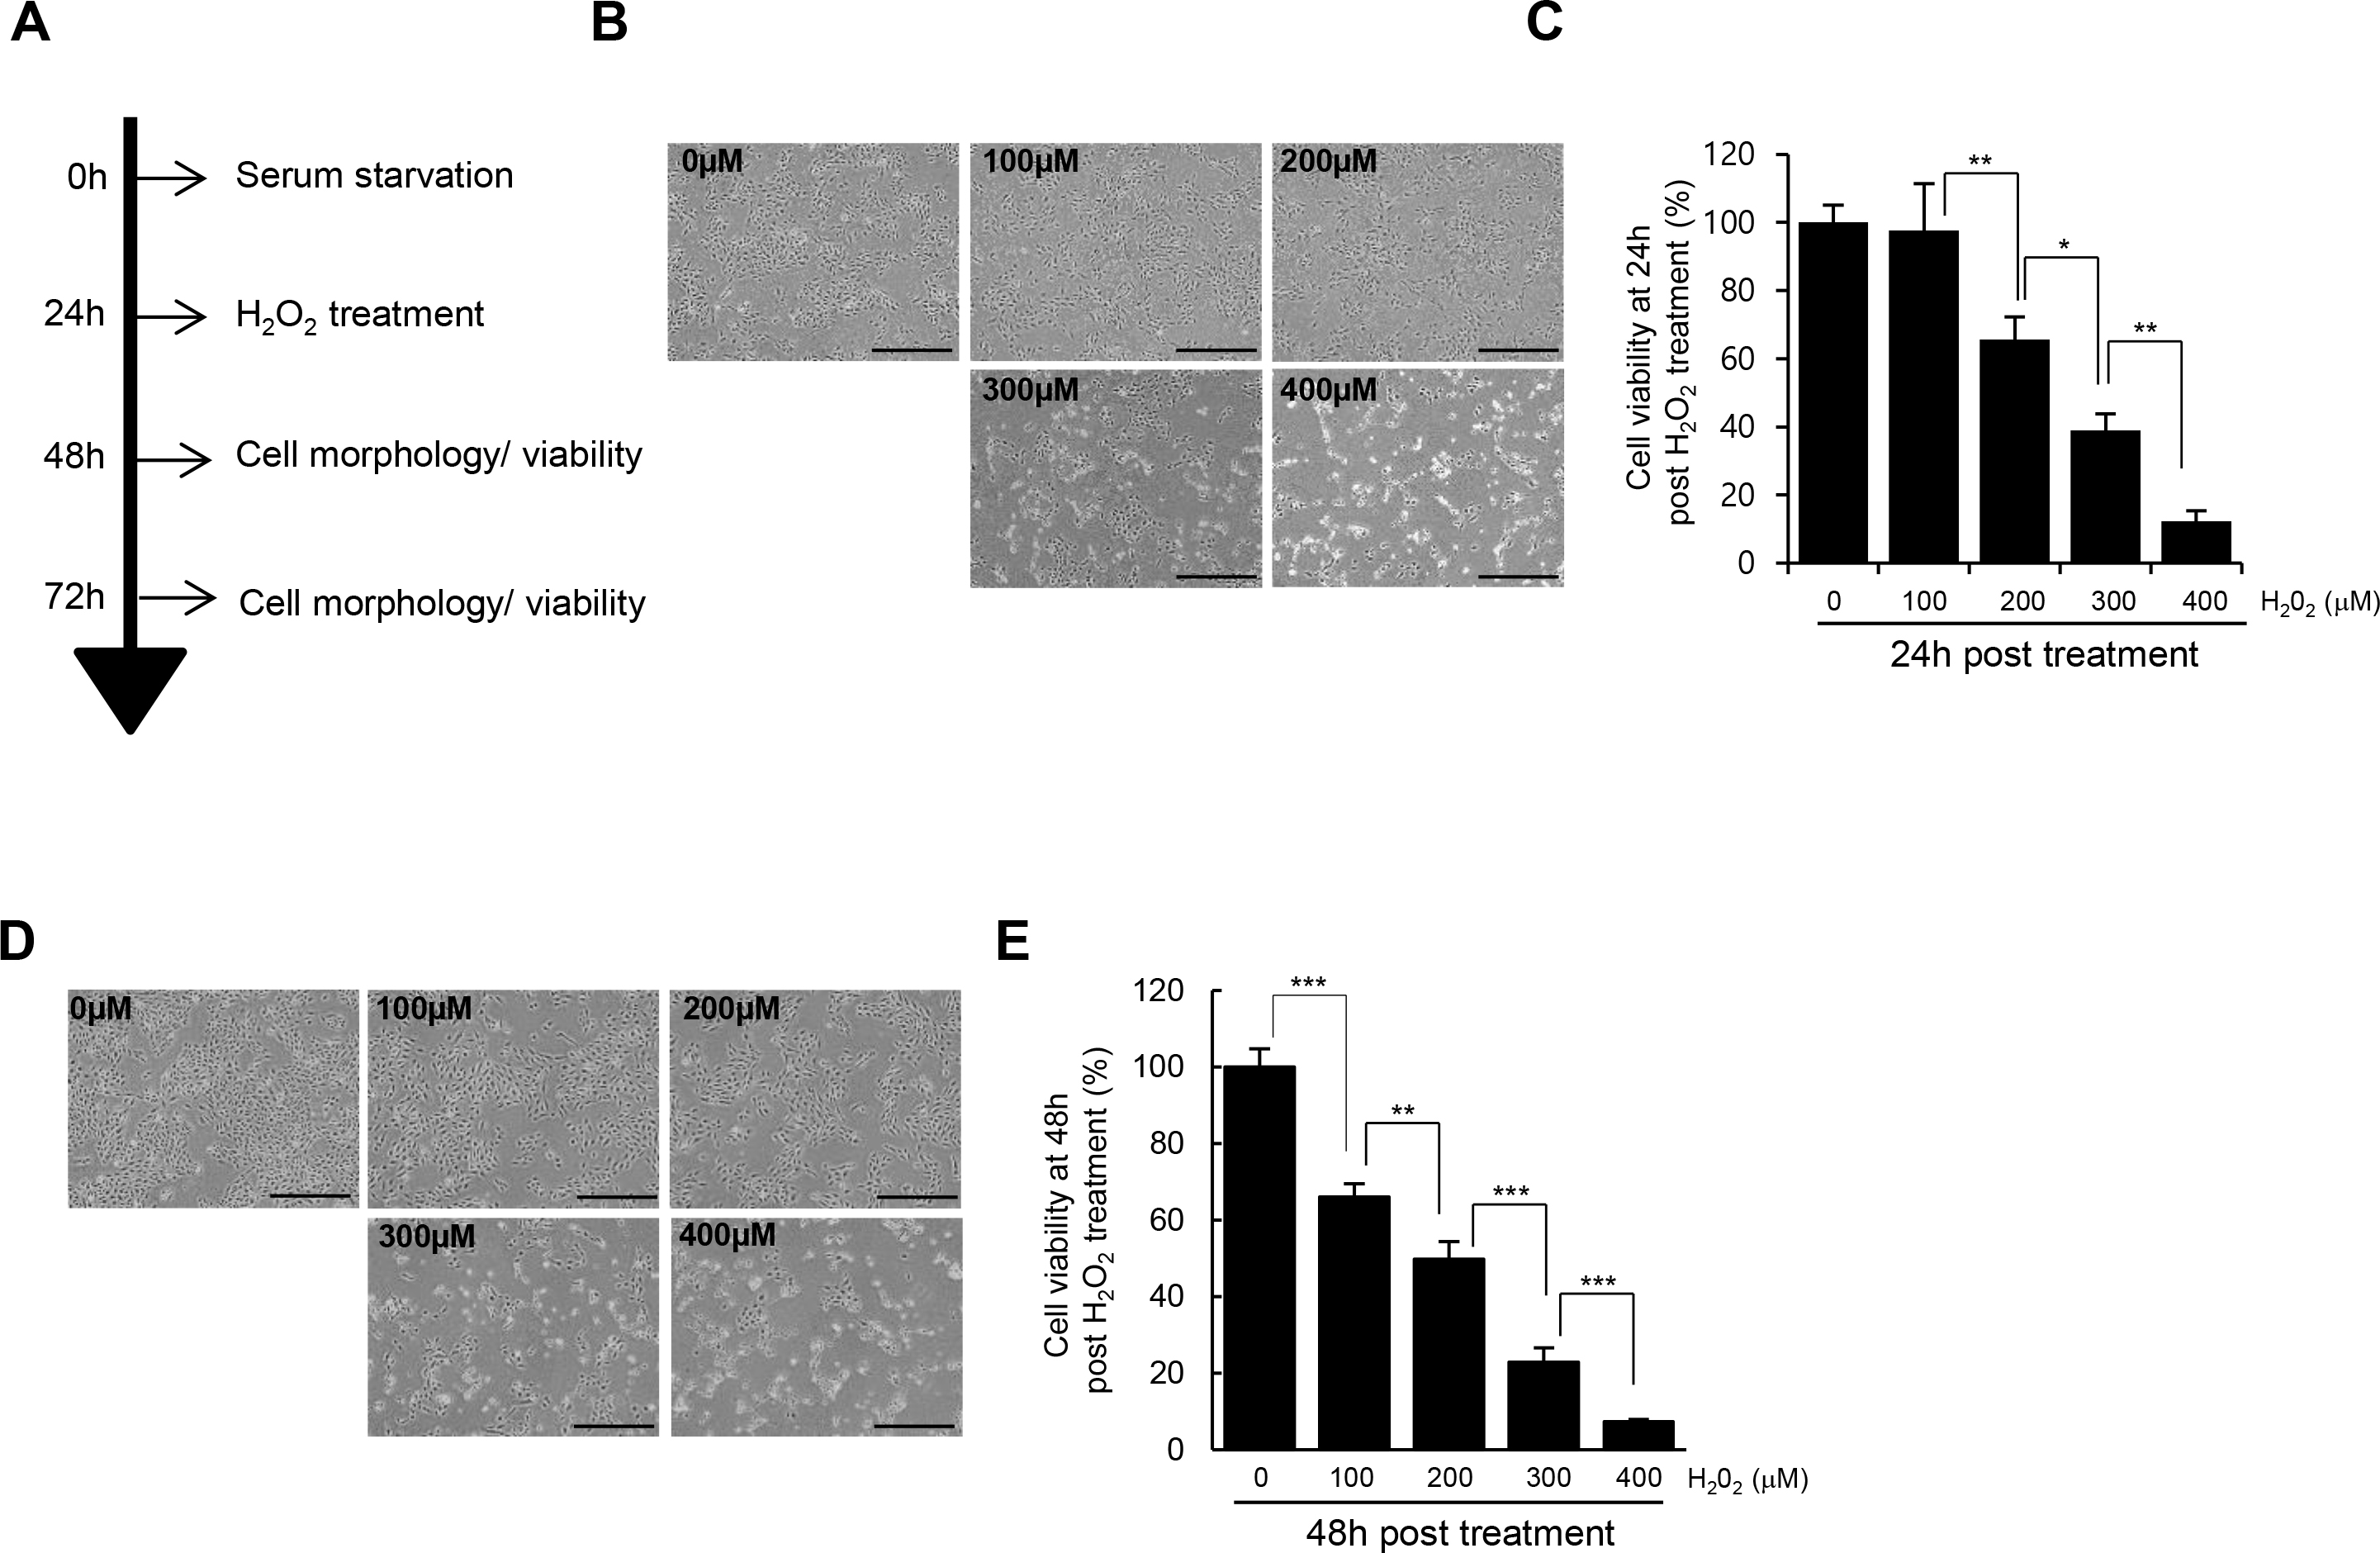
 Figure 1 of
Baek, Mol Vis 2016; 22:1015-1023.
Figure 1 of
Baek, Mol Vis 2016; 22:1015-1023.