Figure 4. Dose–response curve of hyperosmolar stress on TonEBP nuclear translocation in ARPE-19 cells. ARPE-19 cells were incubated
for 4 h with iso-osmolar medium (CT). Cells were incubated for 4 h in media containing the additional presence of increasing
concentrations of NaCl (Na25, Na50, Na100; C, E, G) or sucrose (Su50, Su100, Su200; D, F, H). Negative control (CTNeg) was performed in the sole presence of secondary antibodies. Cells were then fixed and exposed
to immunofluorescent staining of tonicity enhancer binding protein (TonEBP) (in green) as described in the Methods section.
Cell nuclei were stained with 4’,6-diamidino-2-phenylindole (DAPI; blue). Scale bars represent 20 µm. Pictures were taken
at 40X magnification. Data are representative of three independent experiments.
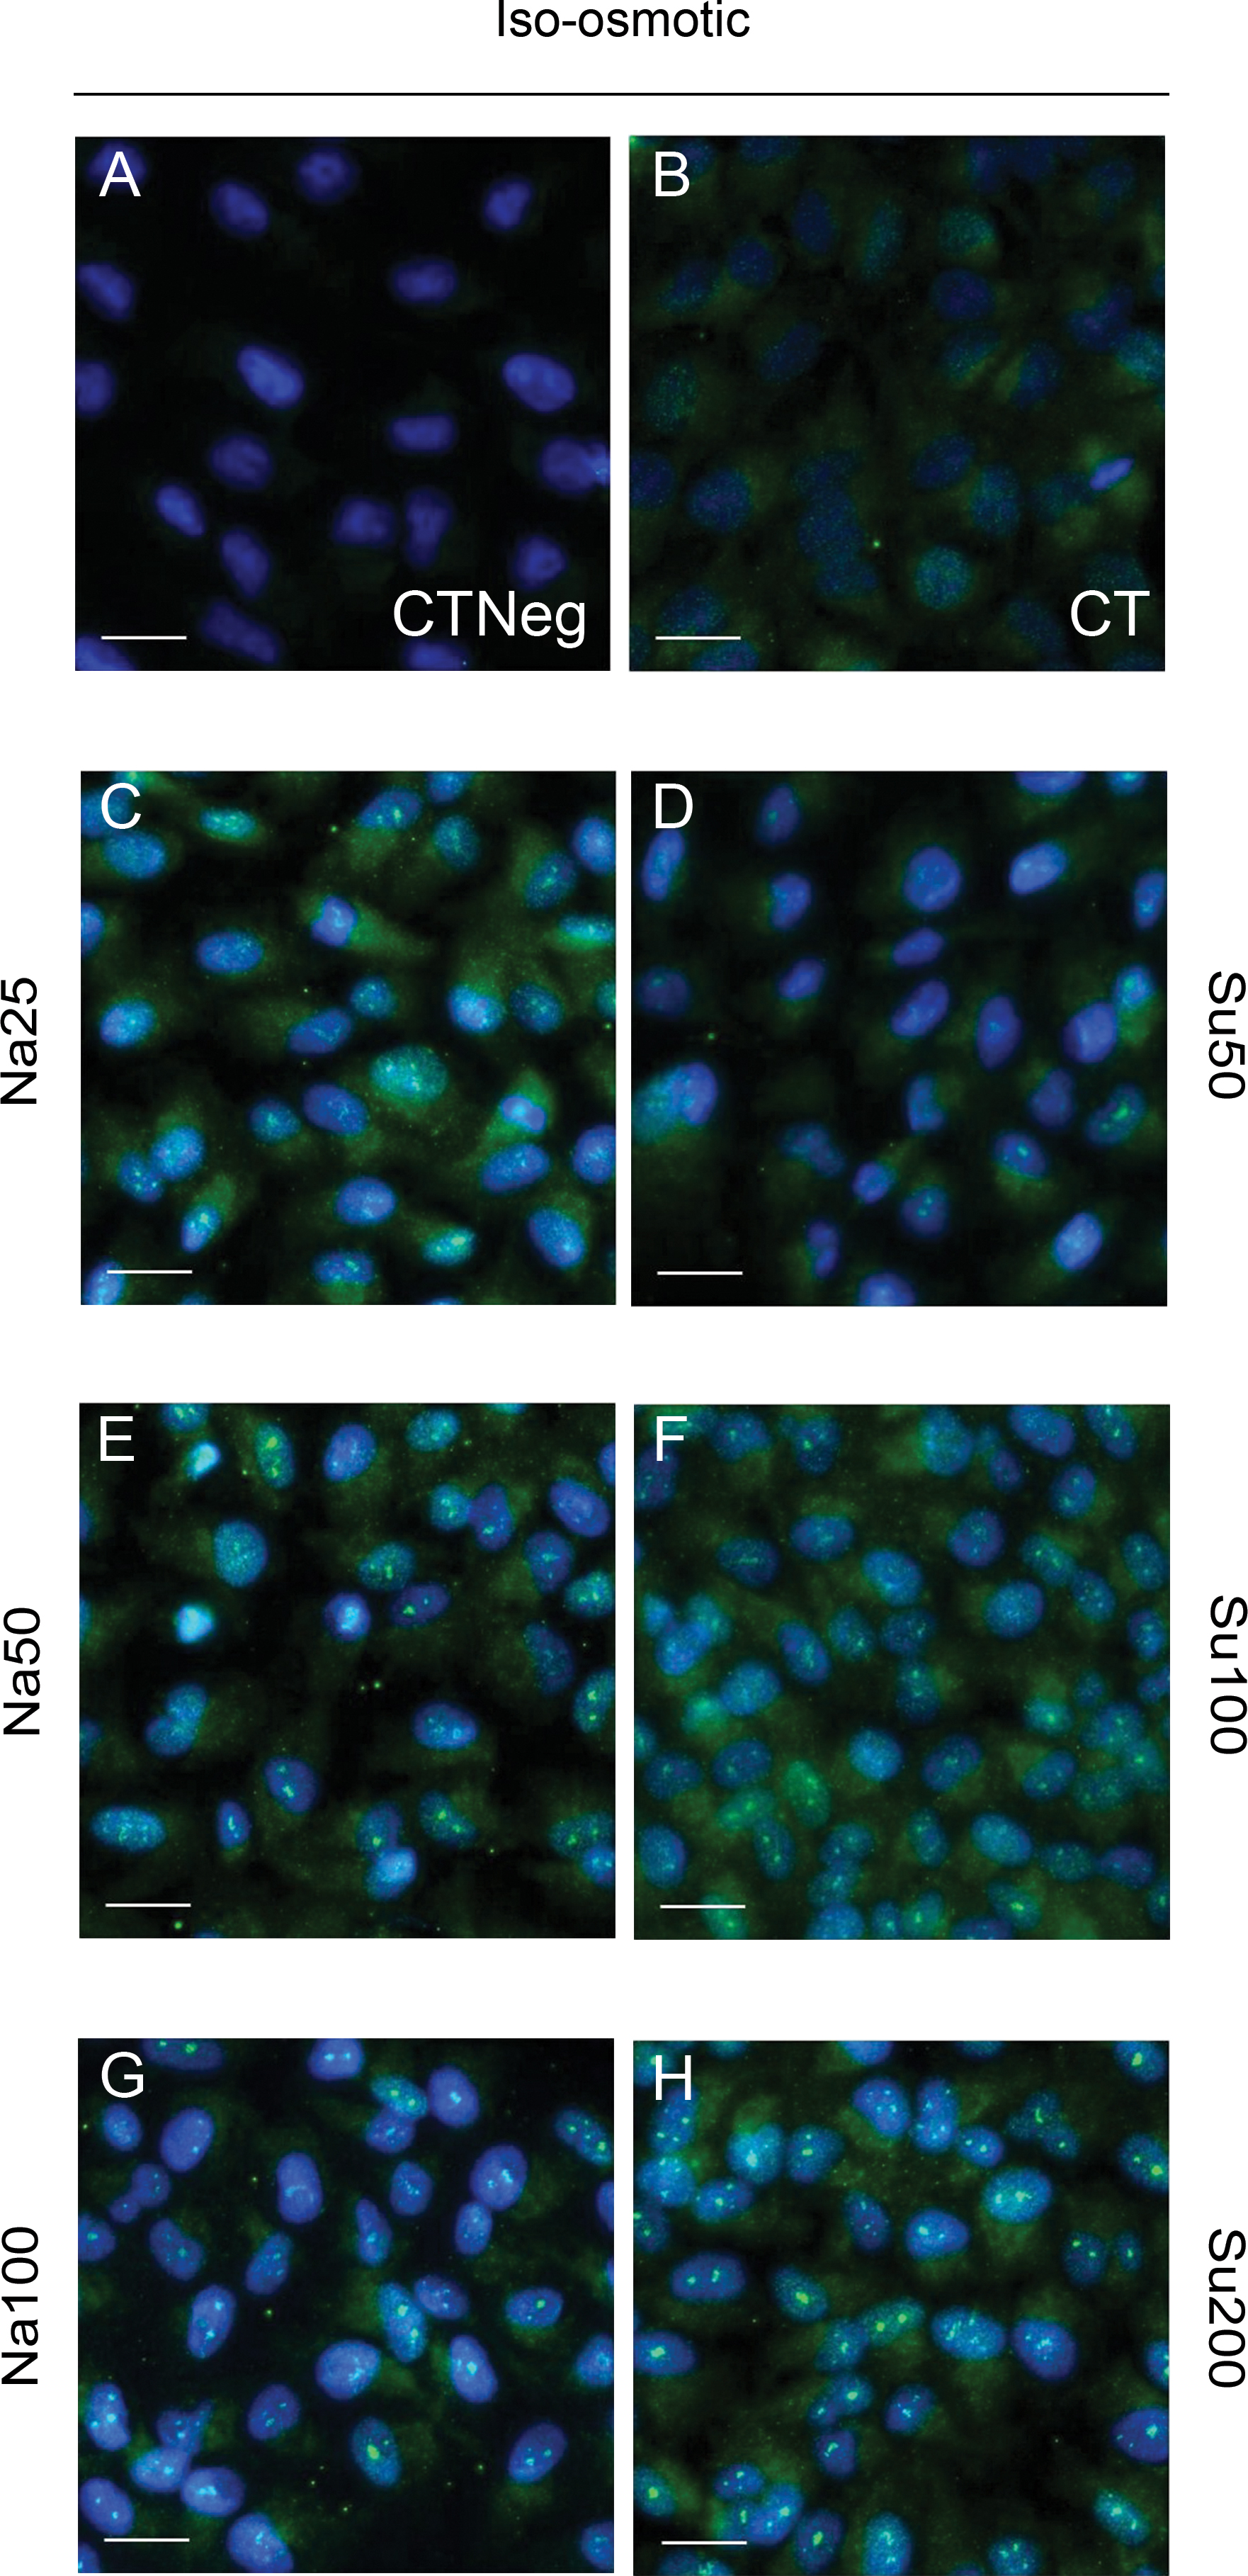
 Figure 4 of
Libert, Mol Vis 2016; 22:100-115.
Figure 4 of
Libert, Mol Vis 2016; 22:100-115.