Figure 1. Kinetics of TonEBP expression in ARPE-19 cells exposed to hyperosmolar stress. A, B: ARPE-19 cells were incubated for 0, 1, 2, 4, 8, 12, or 24 h with iso-osmolar medium (control) or media containing the additional
presence of 100 mM NaCl (Na100) or 200 mM sucrose (Su200). C: ARPE-19 cells were incubated for 4 h under iso-osmolar or hyperosmolar medium (Na100 or Su200), after which 1 µg/ml of actinomycin
D (ActD) was added. Tonicity enhancer binding protein (TonEBP) mRNA levels were determined with real-time quantitative PCR
(RT-qPCR) at 0, 2, 4, 6, and 8 h following the addition of ActD. A, C: TonEBP mRNA levels were measured with RT-qPCR as described in the Methods section. Data are expressed as relative TonEBP
mRNA levels (in fold stimulation) to the 0 h time point set to 1. Data are the mean ± standard error of the mean (SEM; n=3)
and are expressed as TonEBP mRNA levels following normalization with appropriate reference genes (HPRT1, B2M, ATP5B). Data were analyzed using repeated-measures ANOVA and Dunnett’s post-hoc tests. *: p<0.05 and **p <0.01 indicate statistical
significance compared to time 0 h. B: The TonEBP protein levels were determined with semiquantitative western blot analysis. β-actin was used as an internal control
of protein expression. Data are representative of three independent experiments.
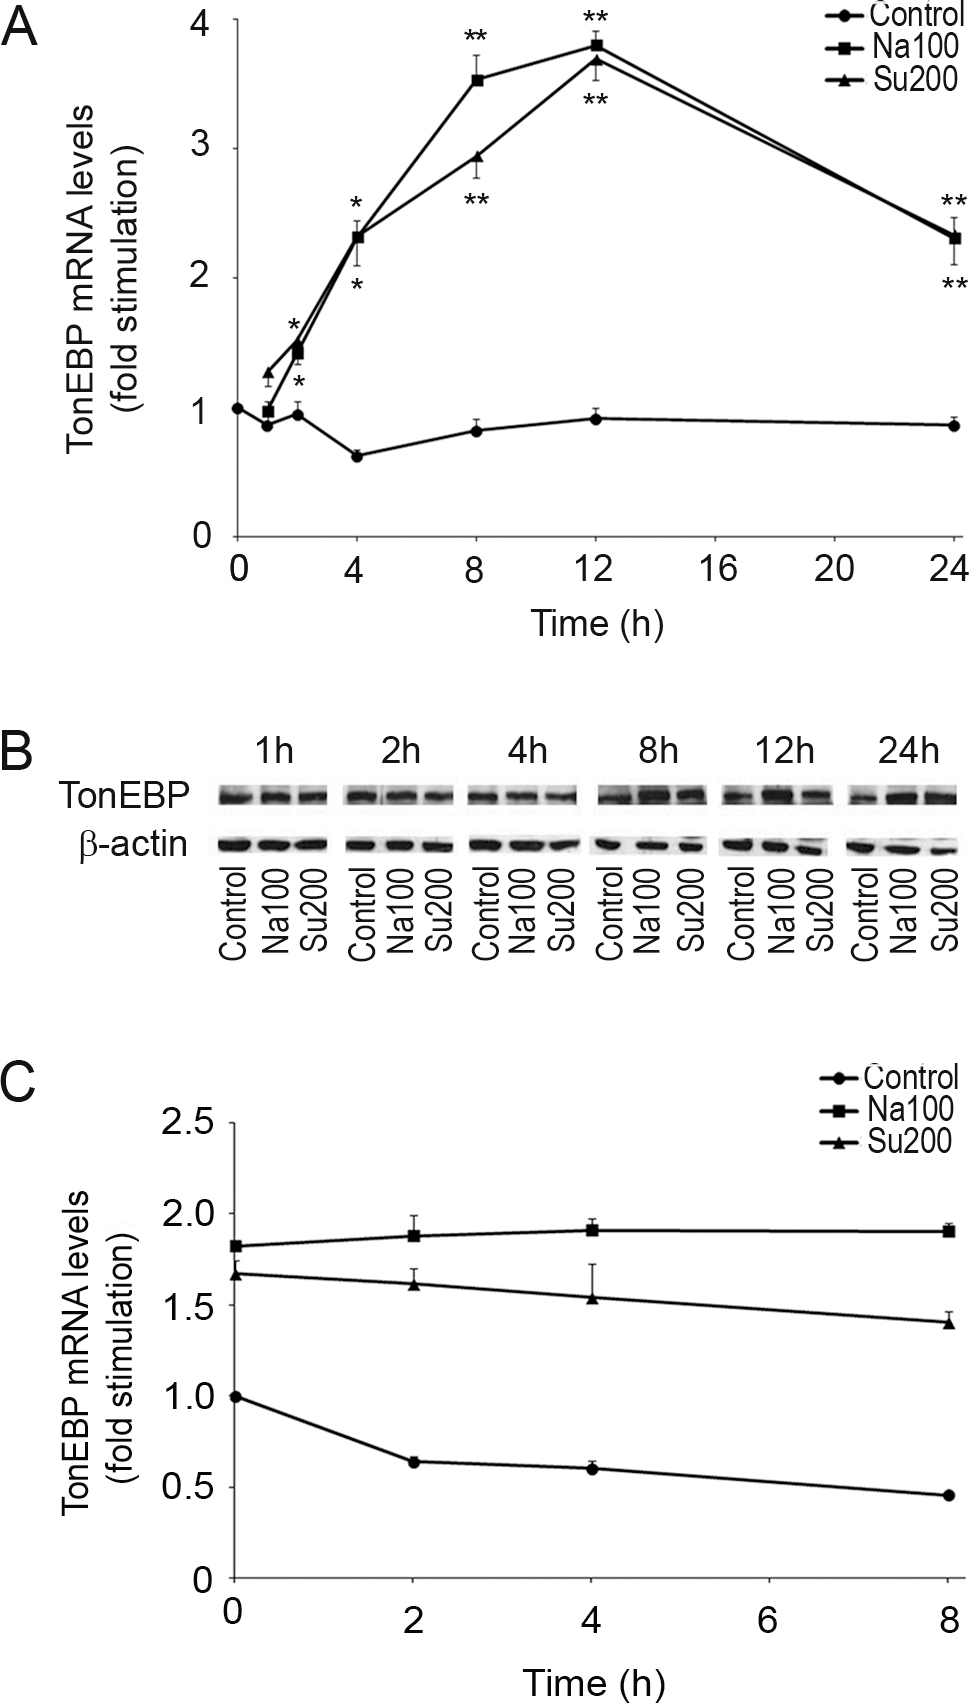
 Figure 1 of
Libert, Mol Vis 2016; 22:100-115.
Figure 1 of
Libert, Mol Vis 2016; 22:100-115.