Figure 3. Correlation analysis between signal indices of polymerase chain reaction (PCR) bands and bacterial bioburden (colony-forming
units per milliliter [CFU/ml]). A: Correlation between cPCR-d (corrected difference in PCR band intensity and background intensity) and the bacterial bioburden.
B: Correlation between cPCR-r (corrected ratio of the PCR intensity and background intensity) and the bacterial bioburden.
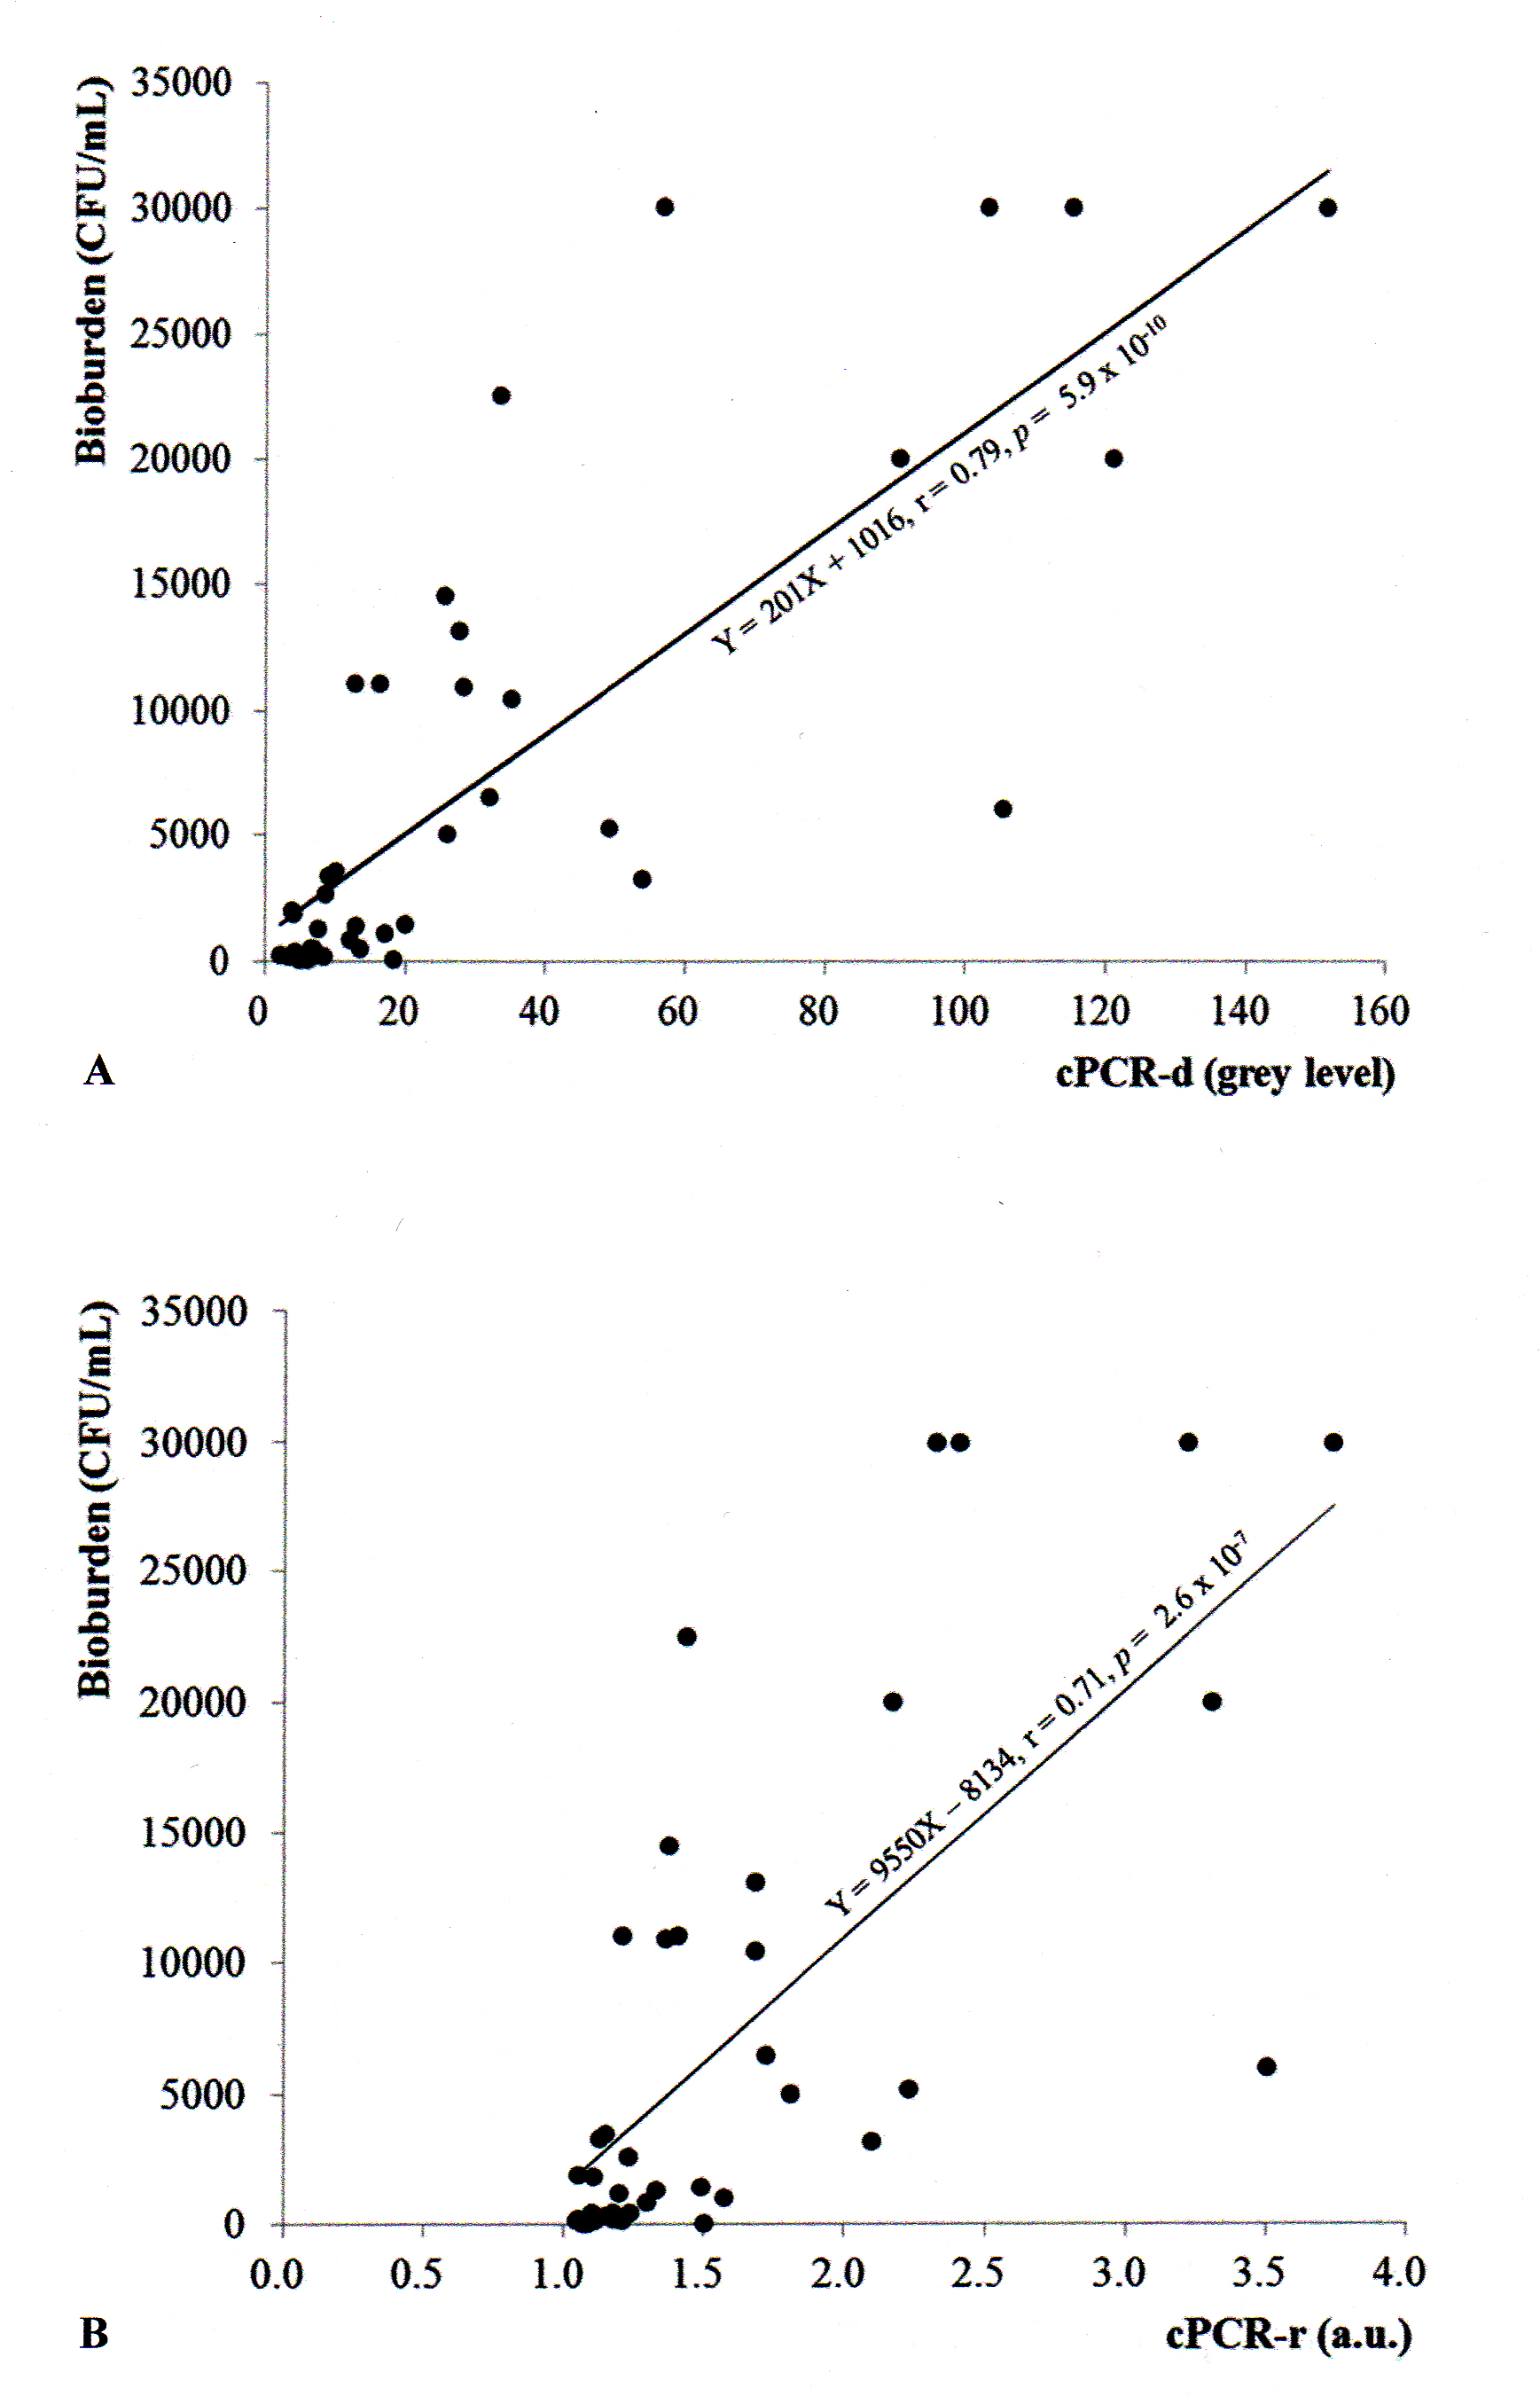
 Figure 3 of
Lo, Mol Vis 2016; 22:1-8.
Figure 3 of
Lo, Mol Vis 2016; 22:1-8.