Figure 1. The PCR gel electrophoresis signal was analyzed with ImageJ software from digital images of the gel. A PCR band was recognized
and defined visually. The background of a PCR band was defined as the hollow rectangular area extending outward by about 1
PCR band width. After grayscale image transformation, the signals of a PCR band and its background were each recorded in triplicate
to determine their mean intensities. M=marker lane. HD=human DNA. MPS=multipurpose solution.
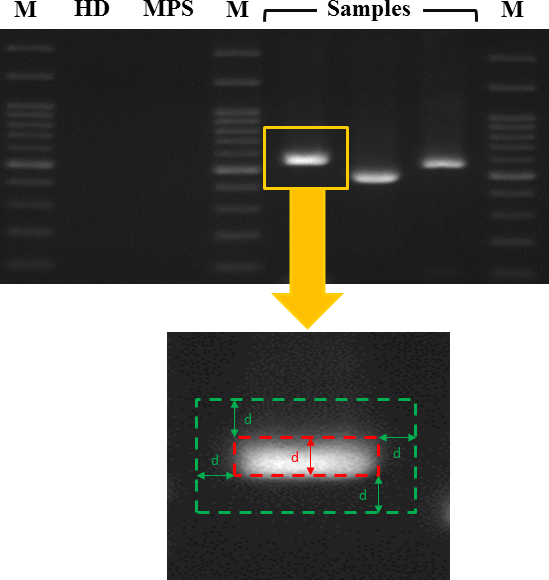
 Figure 1 of
Lo, Mol Vis 2016; 22:1-8.
Figure 1 of
Lo, Mol Vis 2016; 22:1-8.