Figure 6. Effects of disruptors on actin and myosin distributions in the lens. Confocal images of posterior lens capsules showing the
distribution of actin (green) and myosin (red) in a (A) latrunculin-treated lens and (B) its vehicle-treated counterpart, as well as a (C) blebbistatin-treated lens and (D) its vehicle-treated counterpart. Scale bar = 5 µm for all images. Rn values for actin (Rna, green) and myosin (Rnm, red) distributions are included.
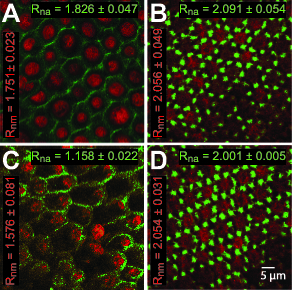
 Figure 6 of
Won, Mol Vis 2015; 21:98-xx.
Figure 6 of
Won, Mol Vis 2015; 21:98-xx.