Figure 5. Effects of disruptors on protein concentrations in the lens. (A) Western blots of f- and g-actin in BMC and lens fiber cell samples treated with latrunculin. Numbers in parentheses represent
the mean percentage optical density (±SEM) relative to the total amount of actin. (B) Western blots of phospho-myosin in BMC and lens fiber cell samples treated with ML-7. Numbers in parentheses represent the
mean optical densities (±SEM). β-actin was used as the loading control.
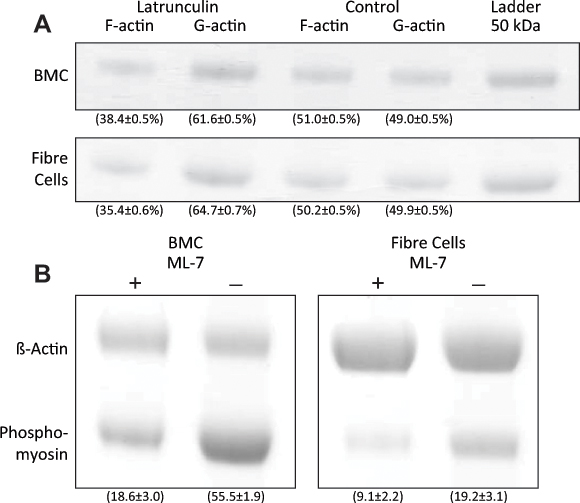
 Figure 5 of
Won, Mol Vis 2015; 21:98-xx.
Figure 5 of
Won, Mol Vis 2015; 21:98-xx.