Figure 3. Representative immunoblotting and immunofluorescence images showing the effect of vorinostat (2.5 µM) on histone acetylation.
Immunoblotting image and the quantification graph (A) showing that vorinostat (+vorinostat) caused eight fold and 50 fold (Ψ p<0.001) increase in acetylhistone H3 and acetylhistone
H4 protein levels in comparison to DMSO-treated vehicle controls (–vorinostat). Immunofluorescence images (B) show significantly more nuclei (p<0.001) stained +ve for acetylhistone H3 (Green) in vorinostat-exposed human corneal fibroblast
cultures (+vorinostat) as compared to non-treated controls (–vorinostat). The DAPI-staining (blue) depicts that there was
no significant difference in the total number of nuclei between control and vorinostat-treated cultures. Scale bar=100 μm.
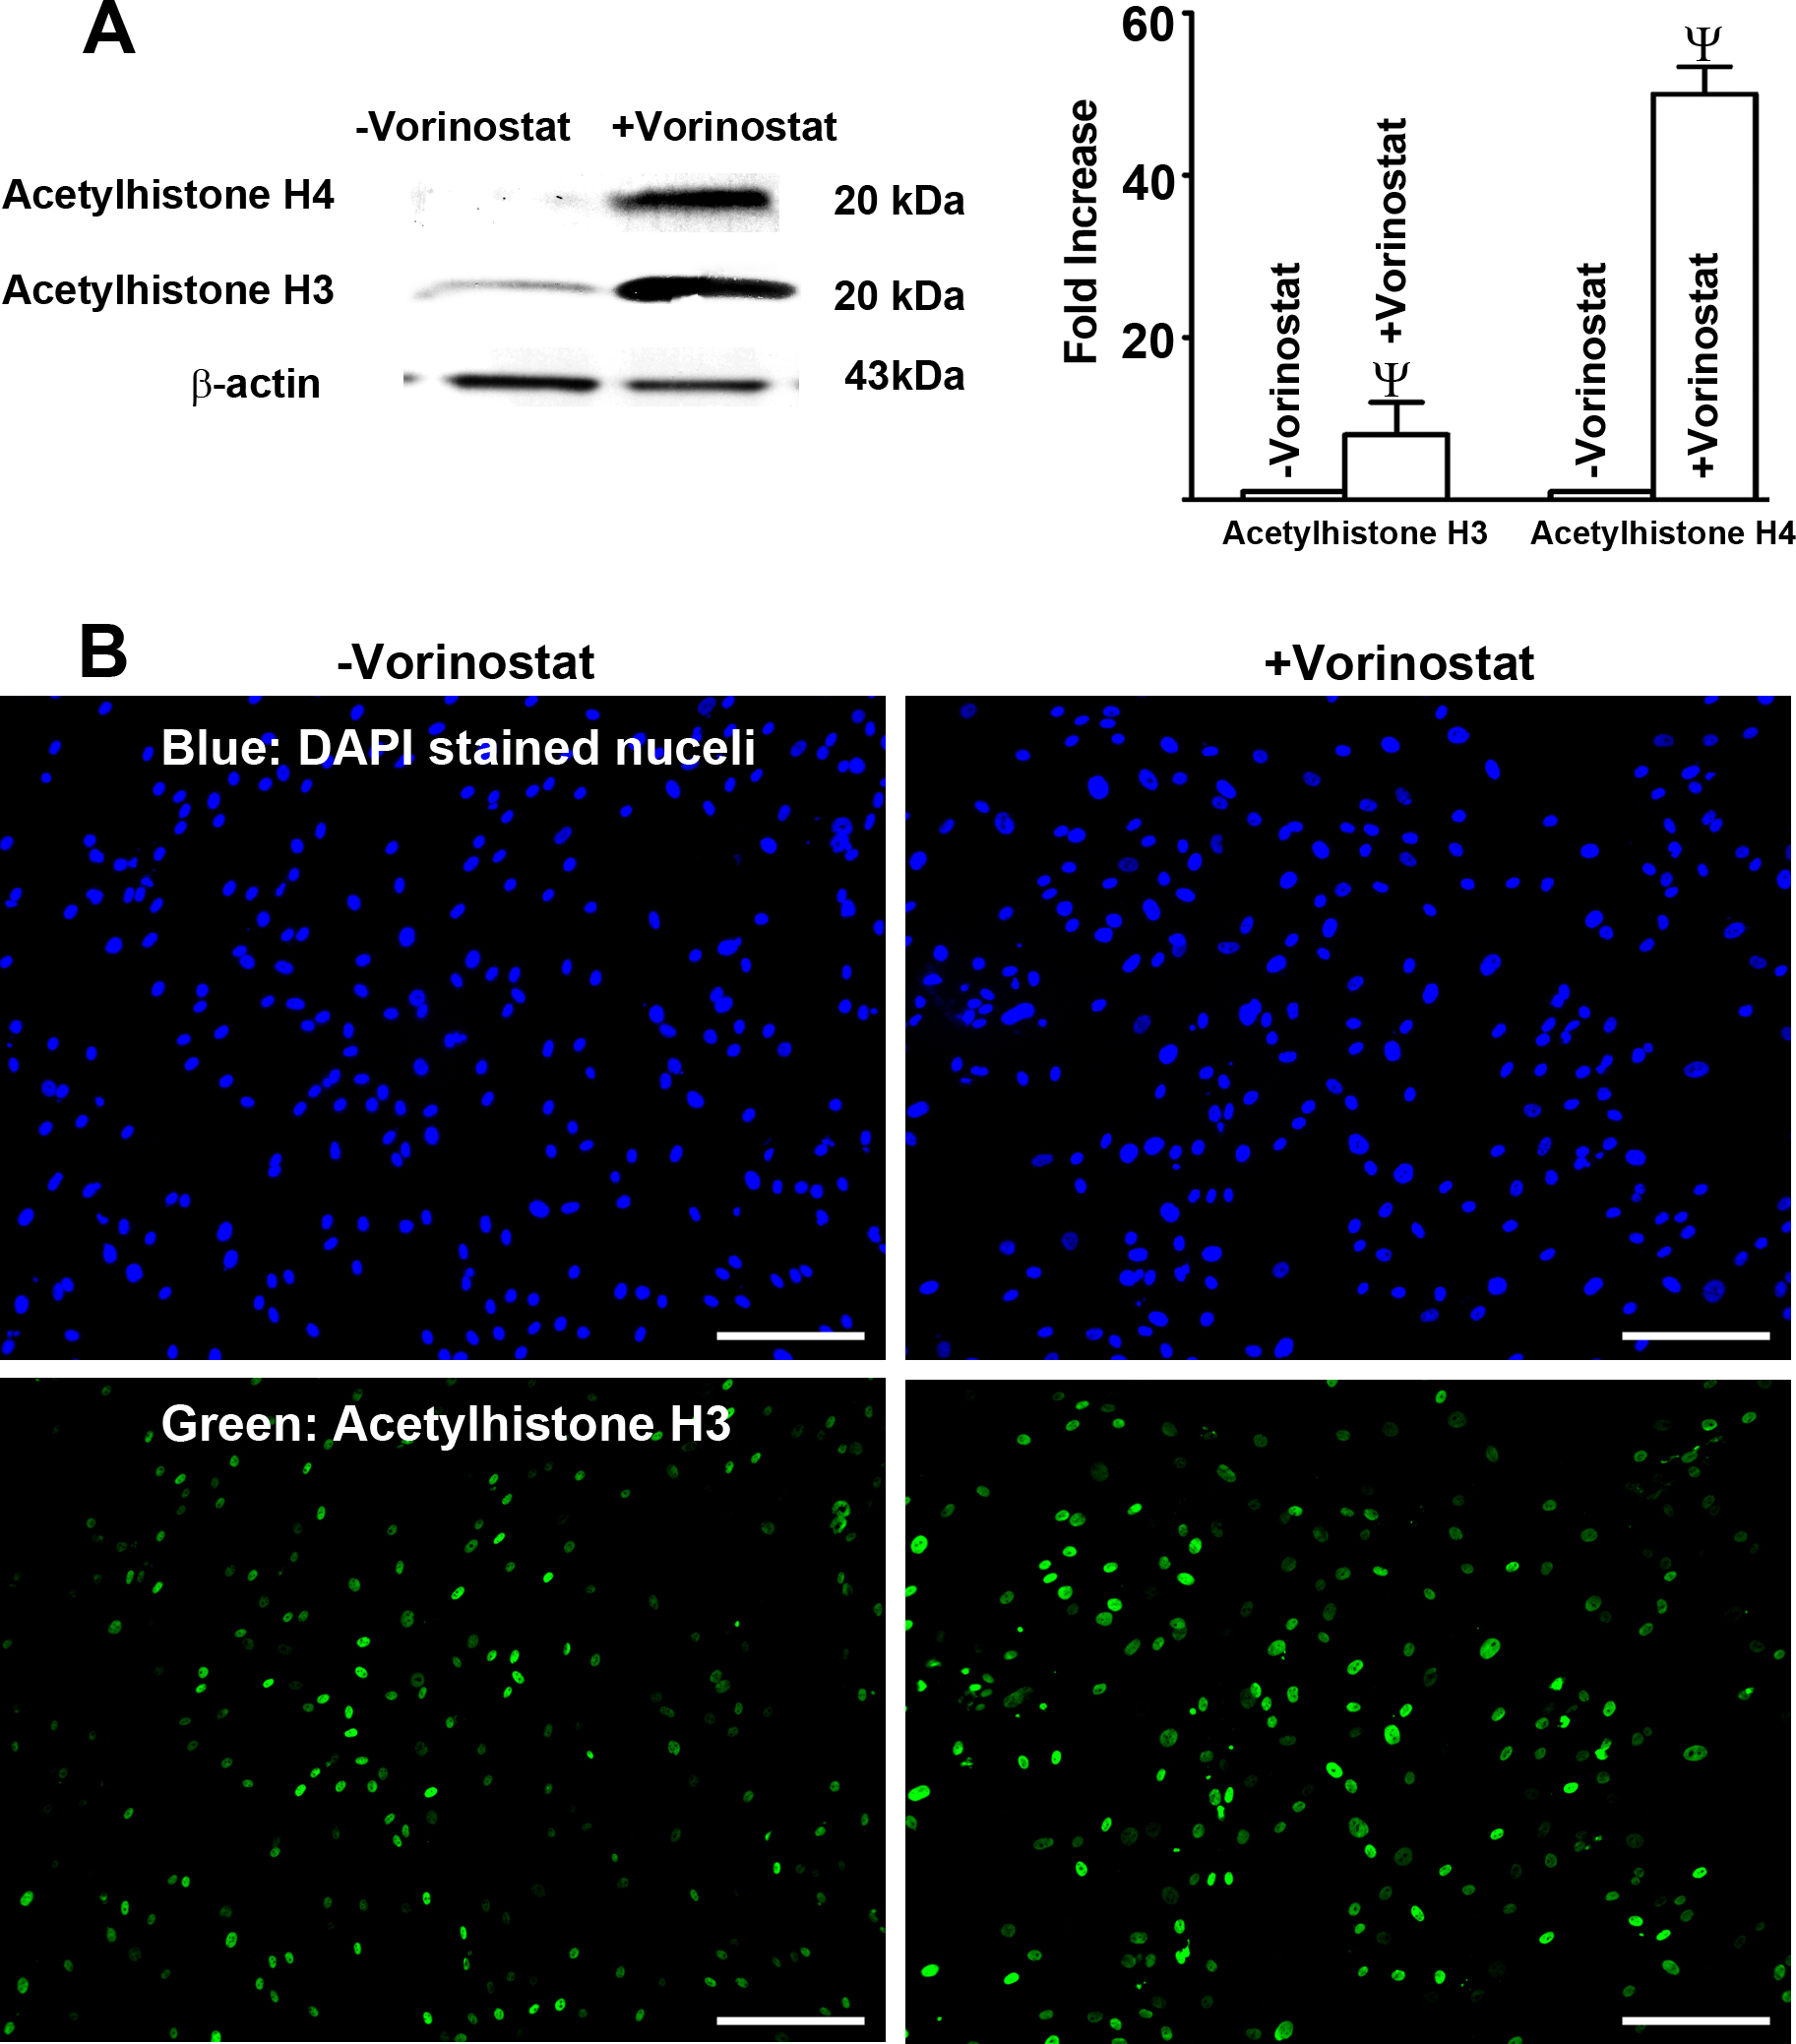
 Figure 3 of
Sharma, Mol Vis 2015; 21:974-984.
Figure 3 of
Sharma, Mol Vis 2015; 21:974-984.