Figure 2. Quantitative real-time PCR and immunoblotting demonstrating the effect of vorinostat (2.5 µM) on TGIF1 and TGIF2 mRNA and
protein levels. A significant increase in TGIF1 and TGIF2 mRNA (A) and protein (B) levels is evident after vorinostat treatment (+vorinostat) as compared to DMSO-treated vehicle controls (–vorinostat). *
p<0.05, # p<0.01 compared to vorinostat.
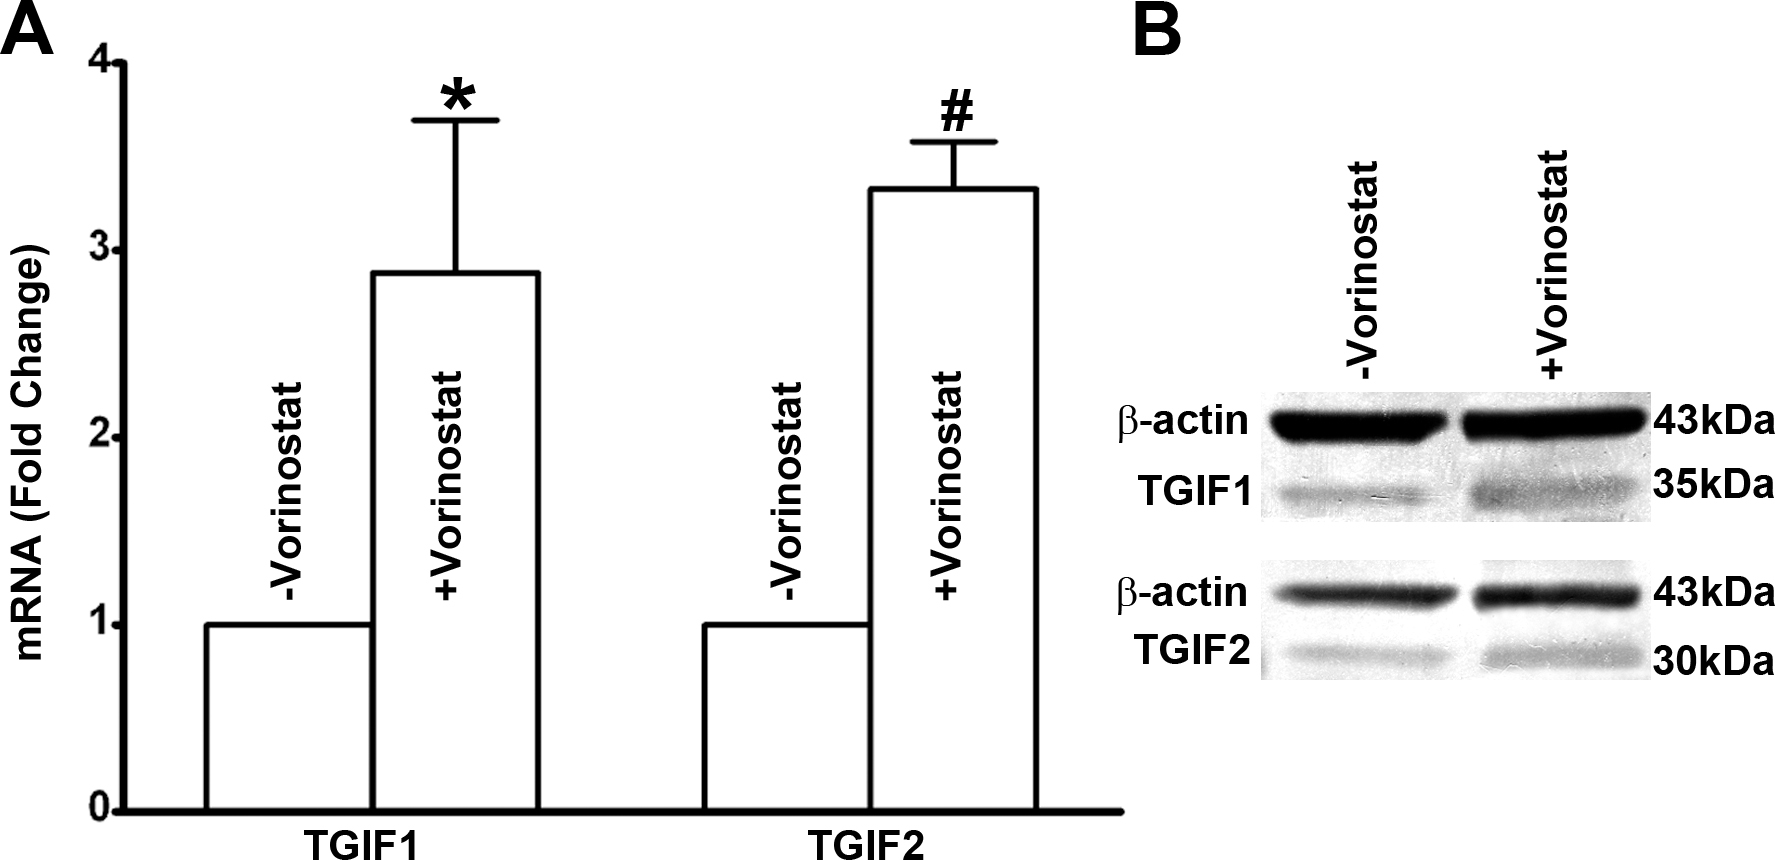
 Figure 2 of
Sharma, Mol Vis 2015; 21:974-984.
Figure 2 of
Sharma, Mol Vis 2015; 21:974-984.