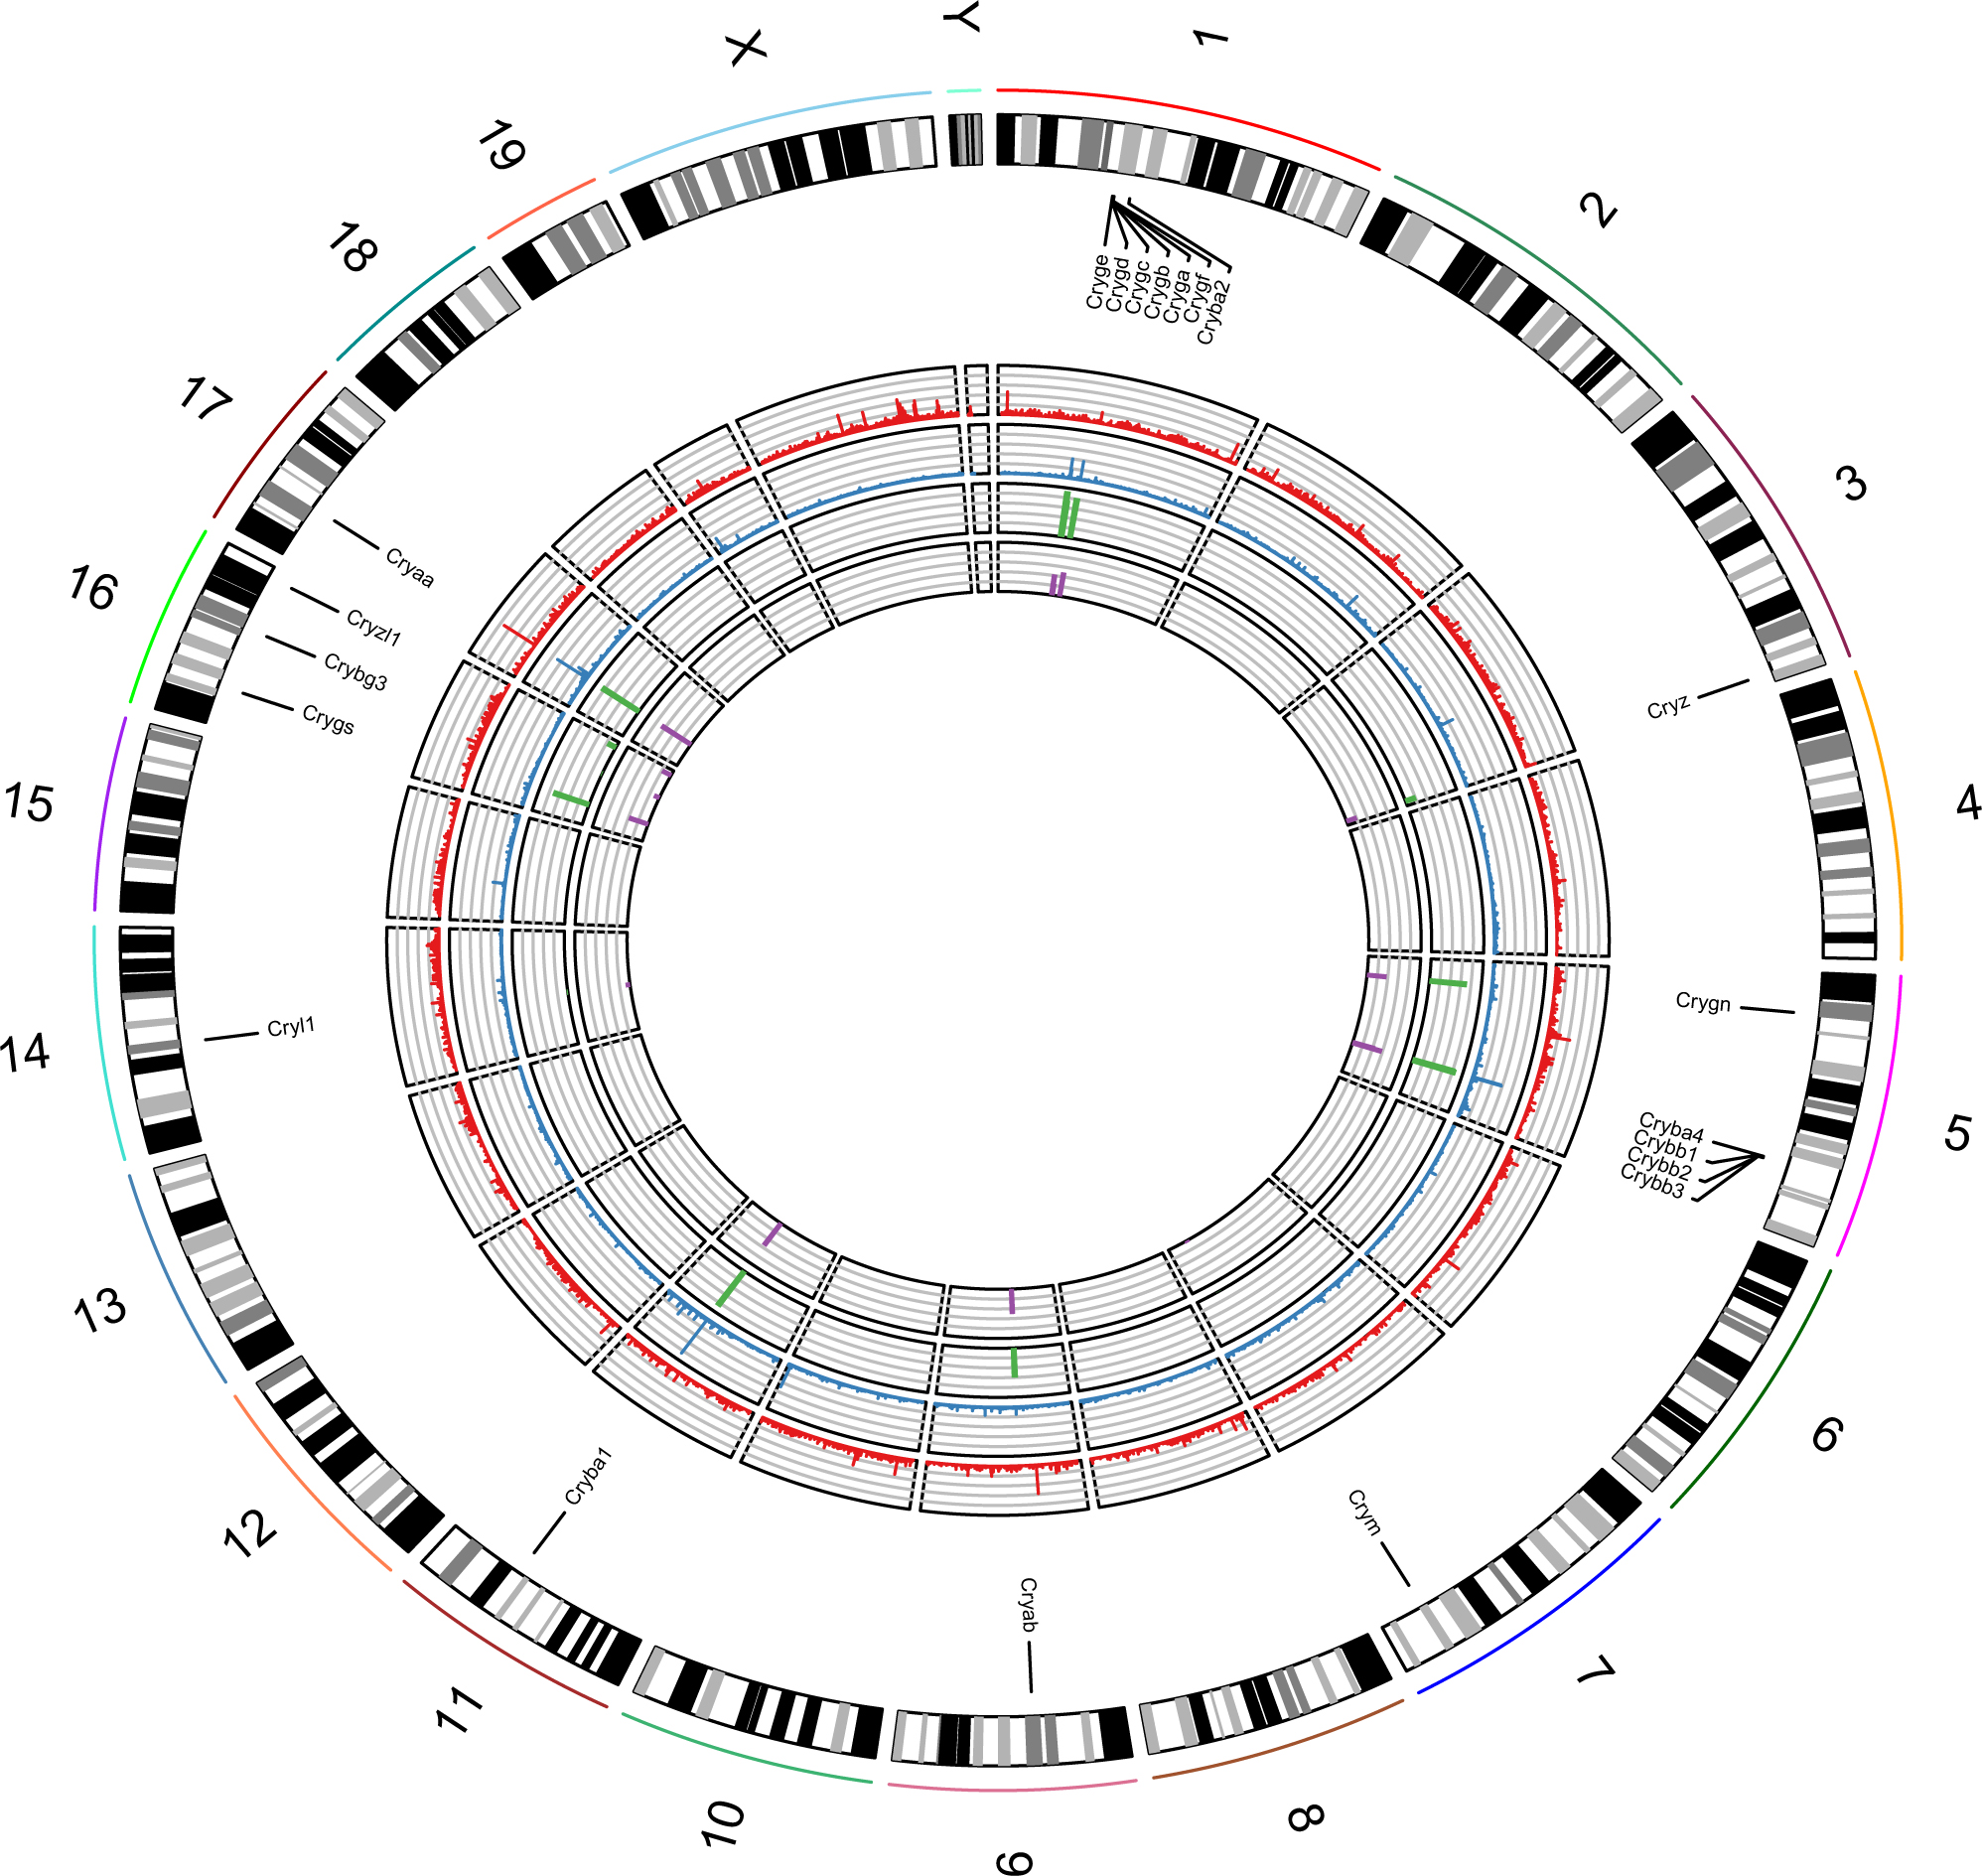
Figure 3. Rcircos [
120] diagram showing “open” chromatin and highly active transcription at many crystallin loci, particularly at the Cryaa. The
circles (outermost to innermost) are genome-wide lens FAIRE-seq read density (red), lens pol II ChIP-seq read density (blue),
and expression levels (RPKMs) of crystallin genes in lens fibers (green) and lens epithelium (purple). Signals from input
lens chromatin have been subtracted for the FAIRE-seq and ChIP-seq data.
 Figure 3 of
Sun, Mol Vis 2015; 21:955-973.
Figure 3 of
Sun, Mol Vis 2015; 21:955-973.