Figure 10. Dynamics of autophagy gene expression in four compartments of E13 embryonic chicken lenses A: Summary of expression data for E13 chicken lenses. B: Tfeb, Foxo1, and Hif1a. C: Ctsd, Gabarapl3 (homolog of Gaparapl1), Park7 (DJ-1), Optn, Wipi1, Wipi2, and Mtor. Central anterior epithelium (blue),
equatorial epithelium (orange), cortical fibers (gray), and central fiber core (yellow).
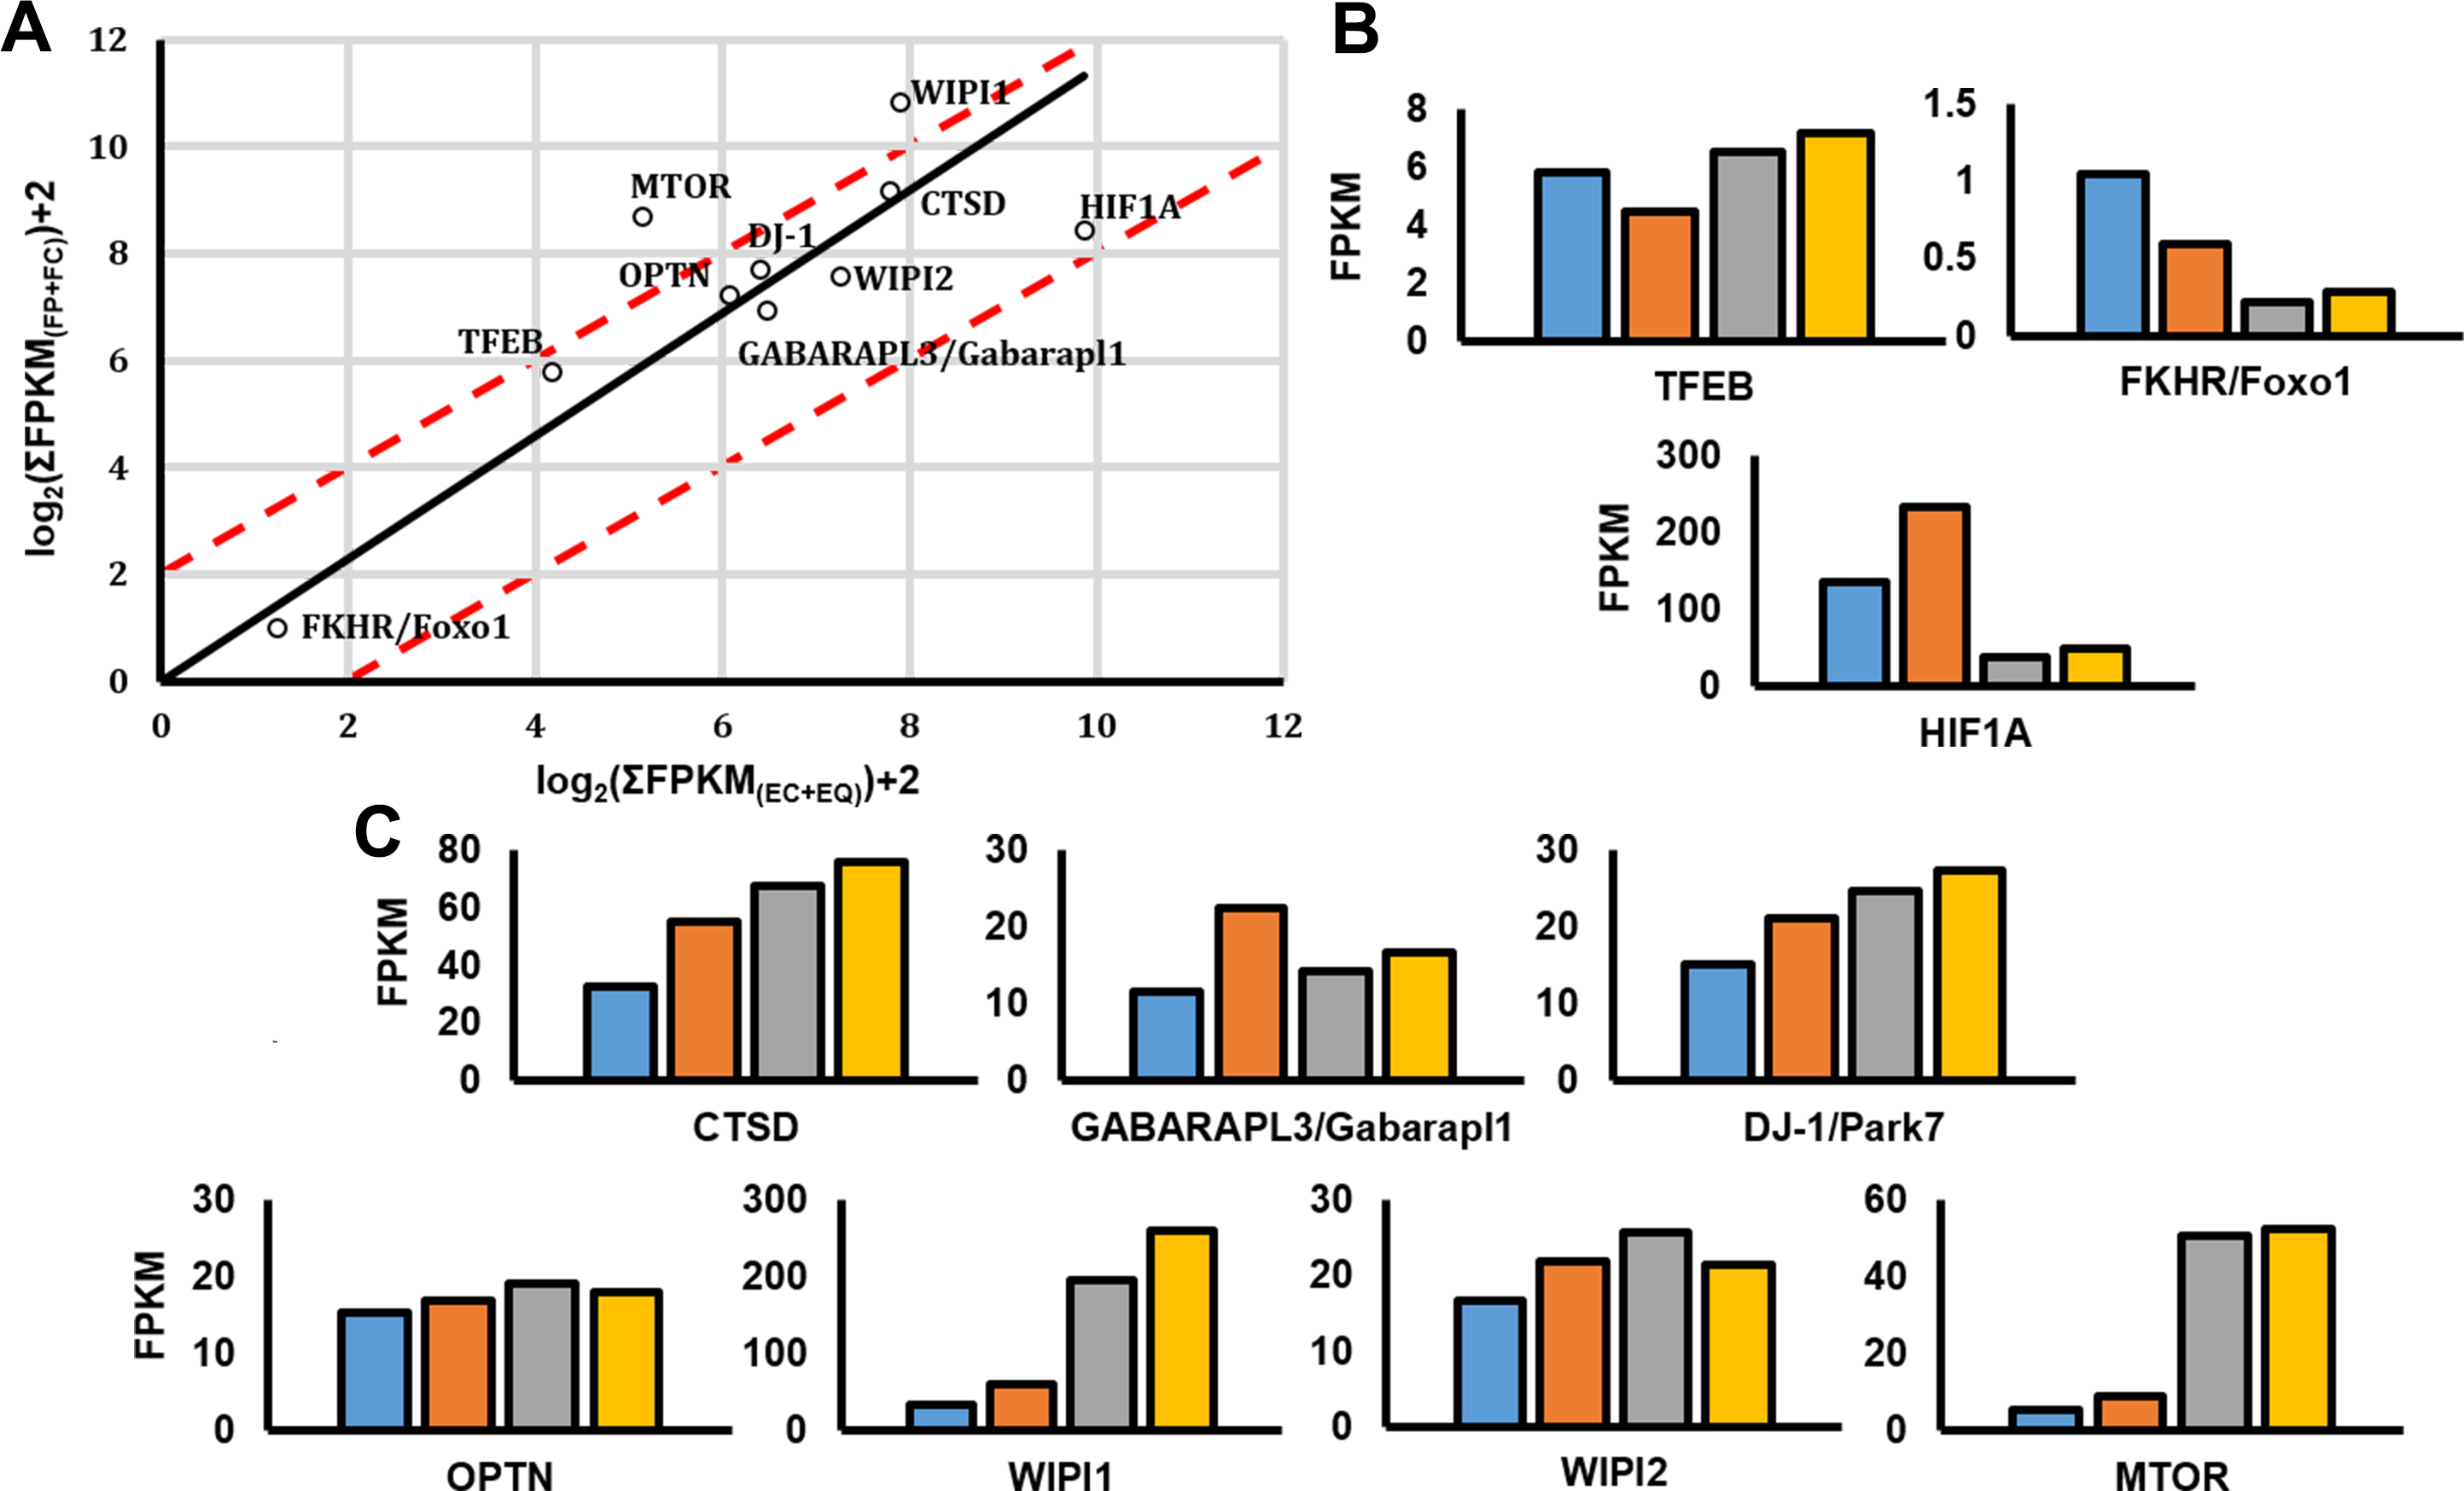
 Figure 10 of
Sun, Mol Vis 2015; 21:955-973.
Figure 10 of
Sun, Mol Vis 2015; 21:955-973.