Figure 3. The downregulation of ZEB1 reduces Transwell invasion. A: ZEB1 protein levels were determined by western blot in OCM1, OMM1, and 92.1 cells, where the ZEB1 expression was reduced
by shRNA. B: An MTS growth assay shows reduction in cell growth only in OMM1 cells, as opposed to OCM1 and 92.1, where growth inhibition
was not observed. C: A Transwell invasion assay shows that ZEB1 downregulation significantly suppressed overnight invasion through Matrigel in
all three cell lines; scrambled shRNA was used as a control. The microphotographs in the lower panel show the invading cells
after staining with hematoxylin. Data shown are mean ± SD; ***p = 0.0001 versus sh-Scramble.
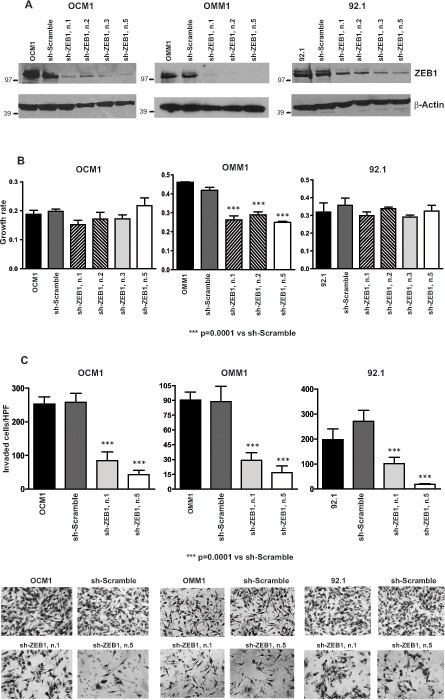
 Figure 3 of
Asnaghi, Mol Vis 2015; 21:919-929.
Figure 3 of
Asnaghi, Mol Vis 2015; 21:919-929.