Figure 1. Protein expression of the EMT-associated factors in uveal melanoma cells lines and primary tumors. A: ZEB1, Twist1, and Snail1 protein levels were determined by western blot in OCM1, Mel285, Mel290, OMM1, and 92.1 uveal melanoma
lines; β-actin was used as a loading control. The time of film exposure during the chemiluminescence reaction was 10 s for
ZEB1 and β-actin and 2 min for Twist1 and Snail1. B: The ZEB1 mRNA expression was measured in 30 uveal melanoma snap-frozen primary tumors and in five cell lines. ZEB1 mRNA
levels were significantly higher in class 2 tumors, compared to class 1, as determined by the two-tailed Fisher Exact probability
test using the median value (0.044) as a cut-off (p = 0.0186). C: Kaplan–Meier survival curve according to the gene expression levels of Twist1 (compared to the log-rank test); low and high
expressions are respectively lower or higher than the median value, which is equal to 6.50.
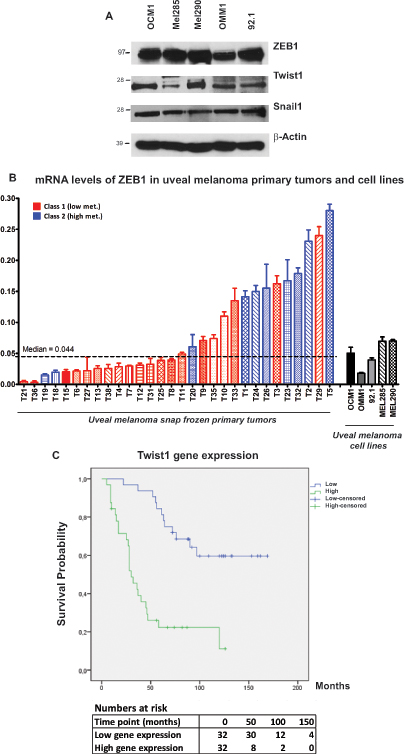
 Figure 1 of
Asnaghi, Mol Vis 2015; 21:919-929.
Figure 1 of
Asnaghi, Mol Vis 2015; 21:919-929.