Figure 2. Scatter plots comparing the relative abundance of 718 proteins/isoforms between specified groups were plotted on a log-log
scale spanning seven orders of magnitude. The black points represent proteins whose abundance differed significantly between
the groups while the aqua points represent proteins whose abundance did not differ significantly between the groups. In some
cases, the relative abundance of a given protein differed substantially between the groups, but the difference was not statistically
significant because the abundance also varied considerably among the individuals within each group. A: No proteins differed significantly in relative abundance between the Ahmed and Baerveldt groups. B: Only one of the 718 proteins differed significantly between the trabeculectomy and Ex-Press groups. C: The relative abundance of 203 proteins differed significantly between the control group (x-axis) and the pooled aqueous
shunt groups (Ahmed and Baerveldt, y-axis). D: The relative abundance of 380 proteins differed significantly between the control group (x-axis) and the pooled trabeculectomy
and Ex-Press groups (y-axis).
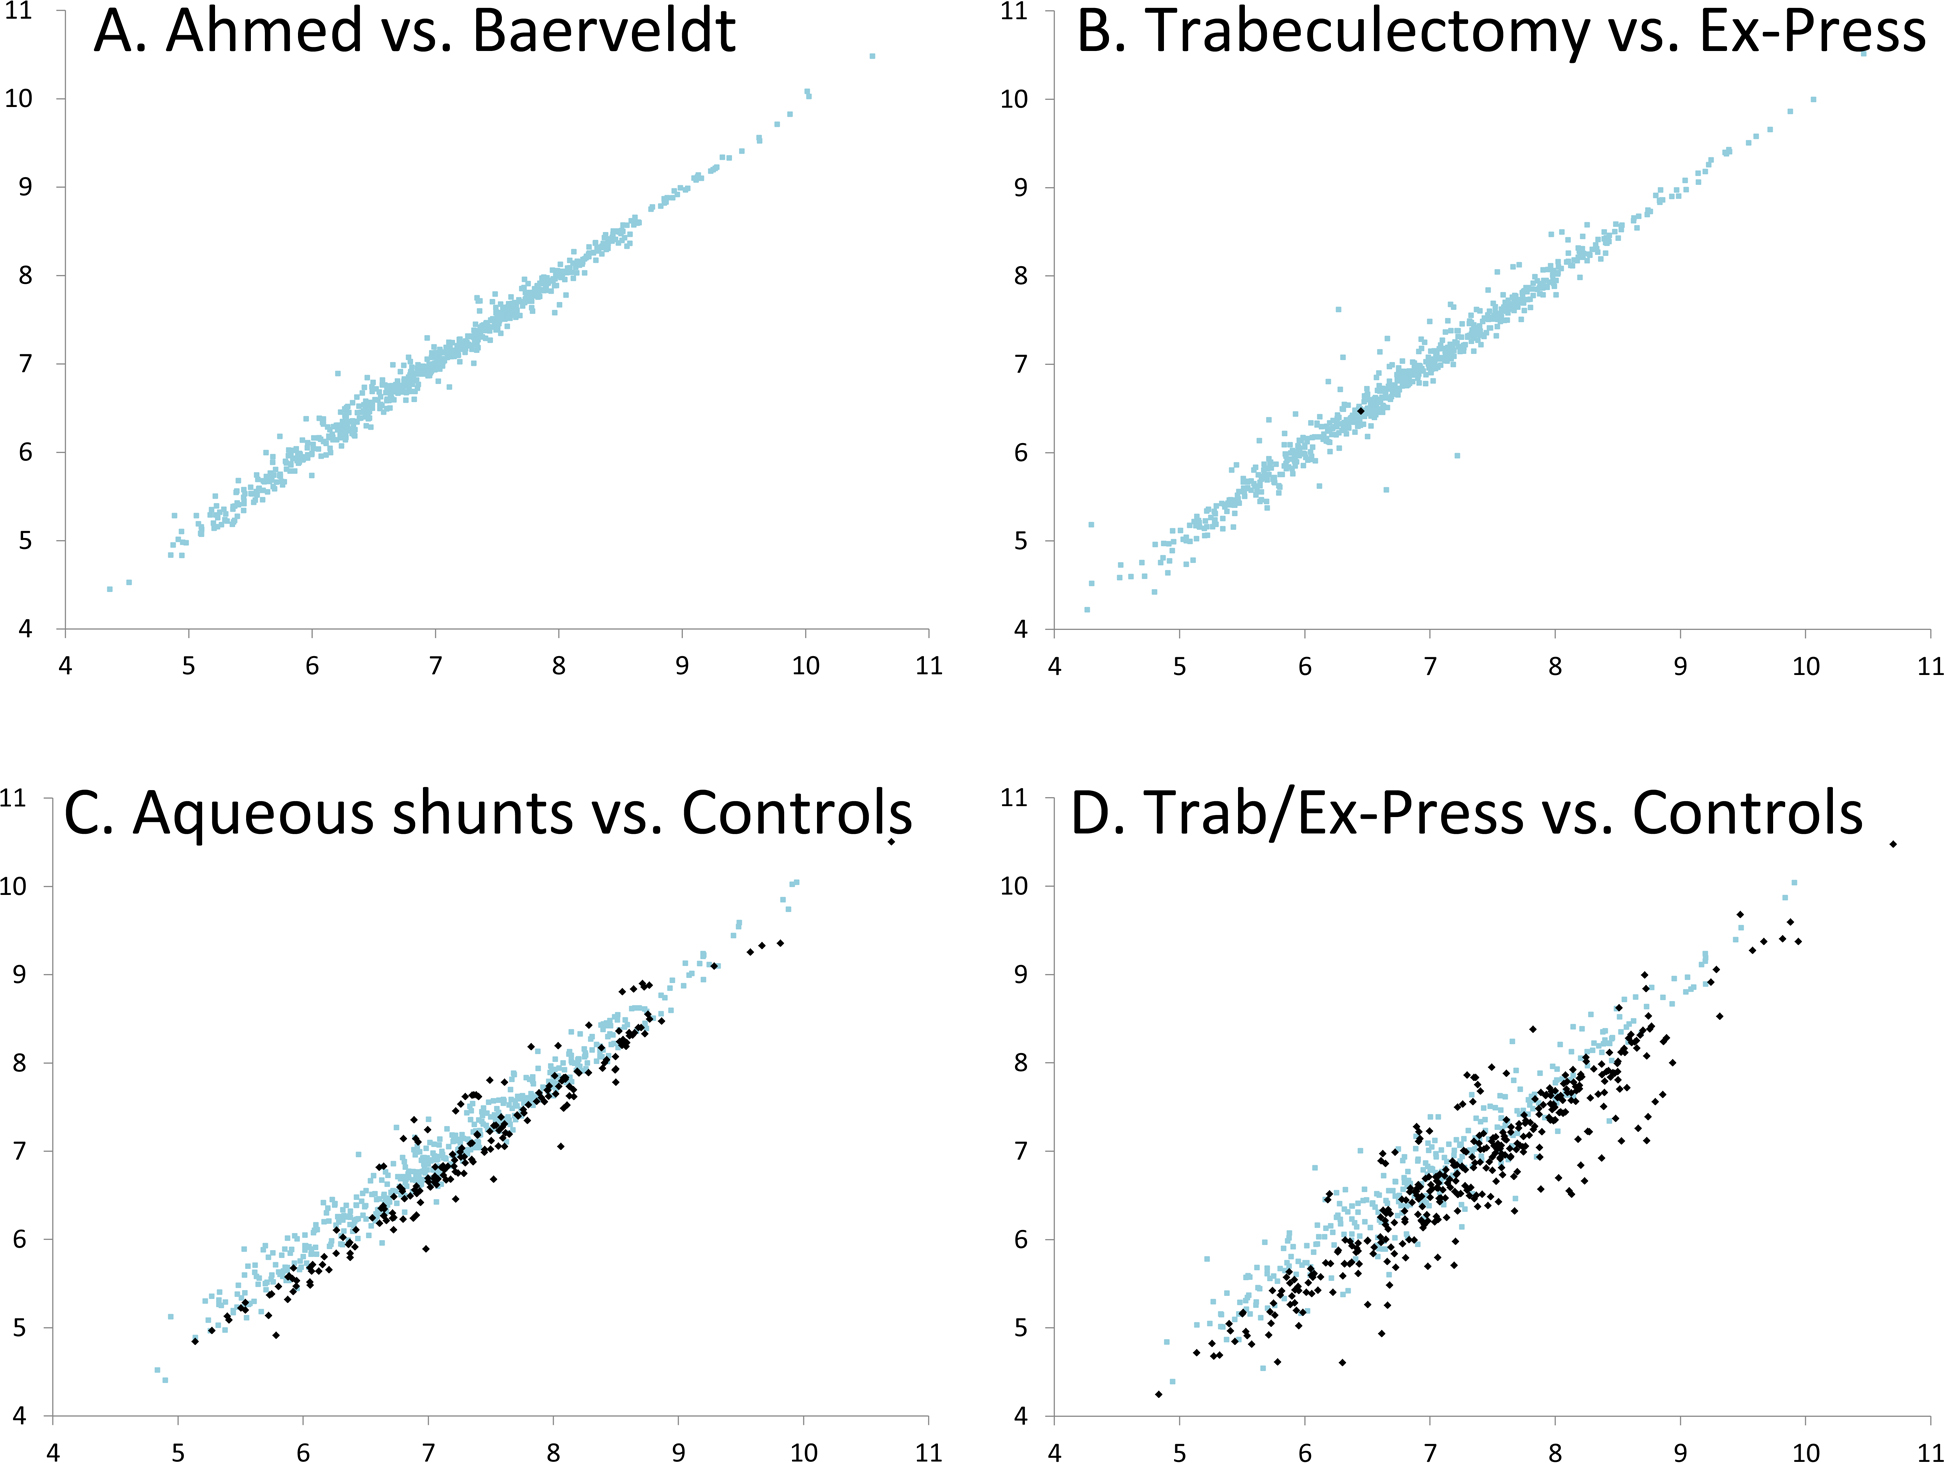
 Figure 2 of
Rosenfeld, Mol Vis 2015; 21:911-918.
Figure 2 of
Rosenfeld, Mol Vis 2015; 21:911-918.