Figure 1. Total protein concentration in aqueous humor by group. In the box plots, the horizontal lines denote medians, the bottom and
top of the boxes represent the 25th and 75th percentiles, respectively, and the vertical lines extend to the minimum and maximum values.
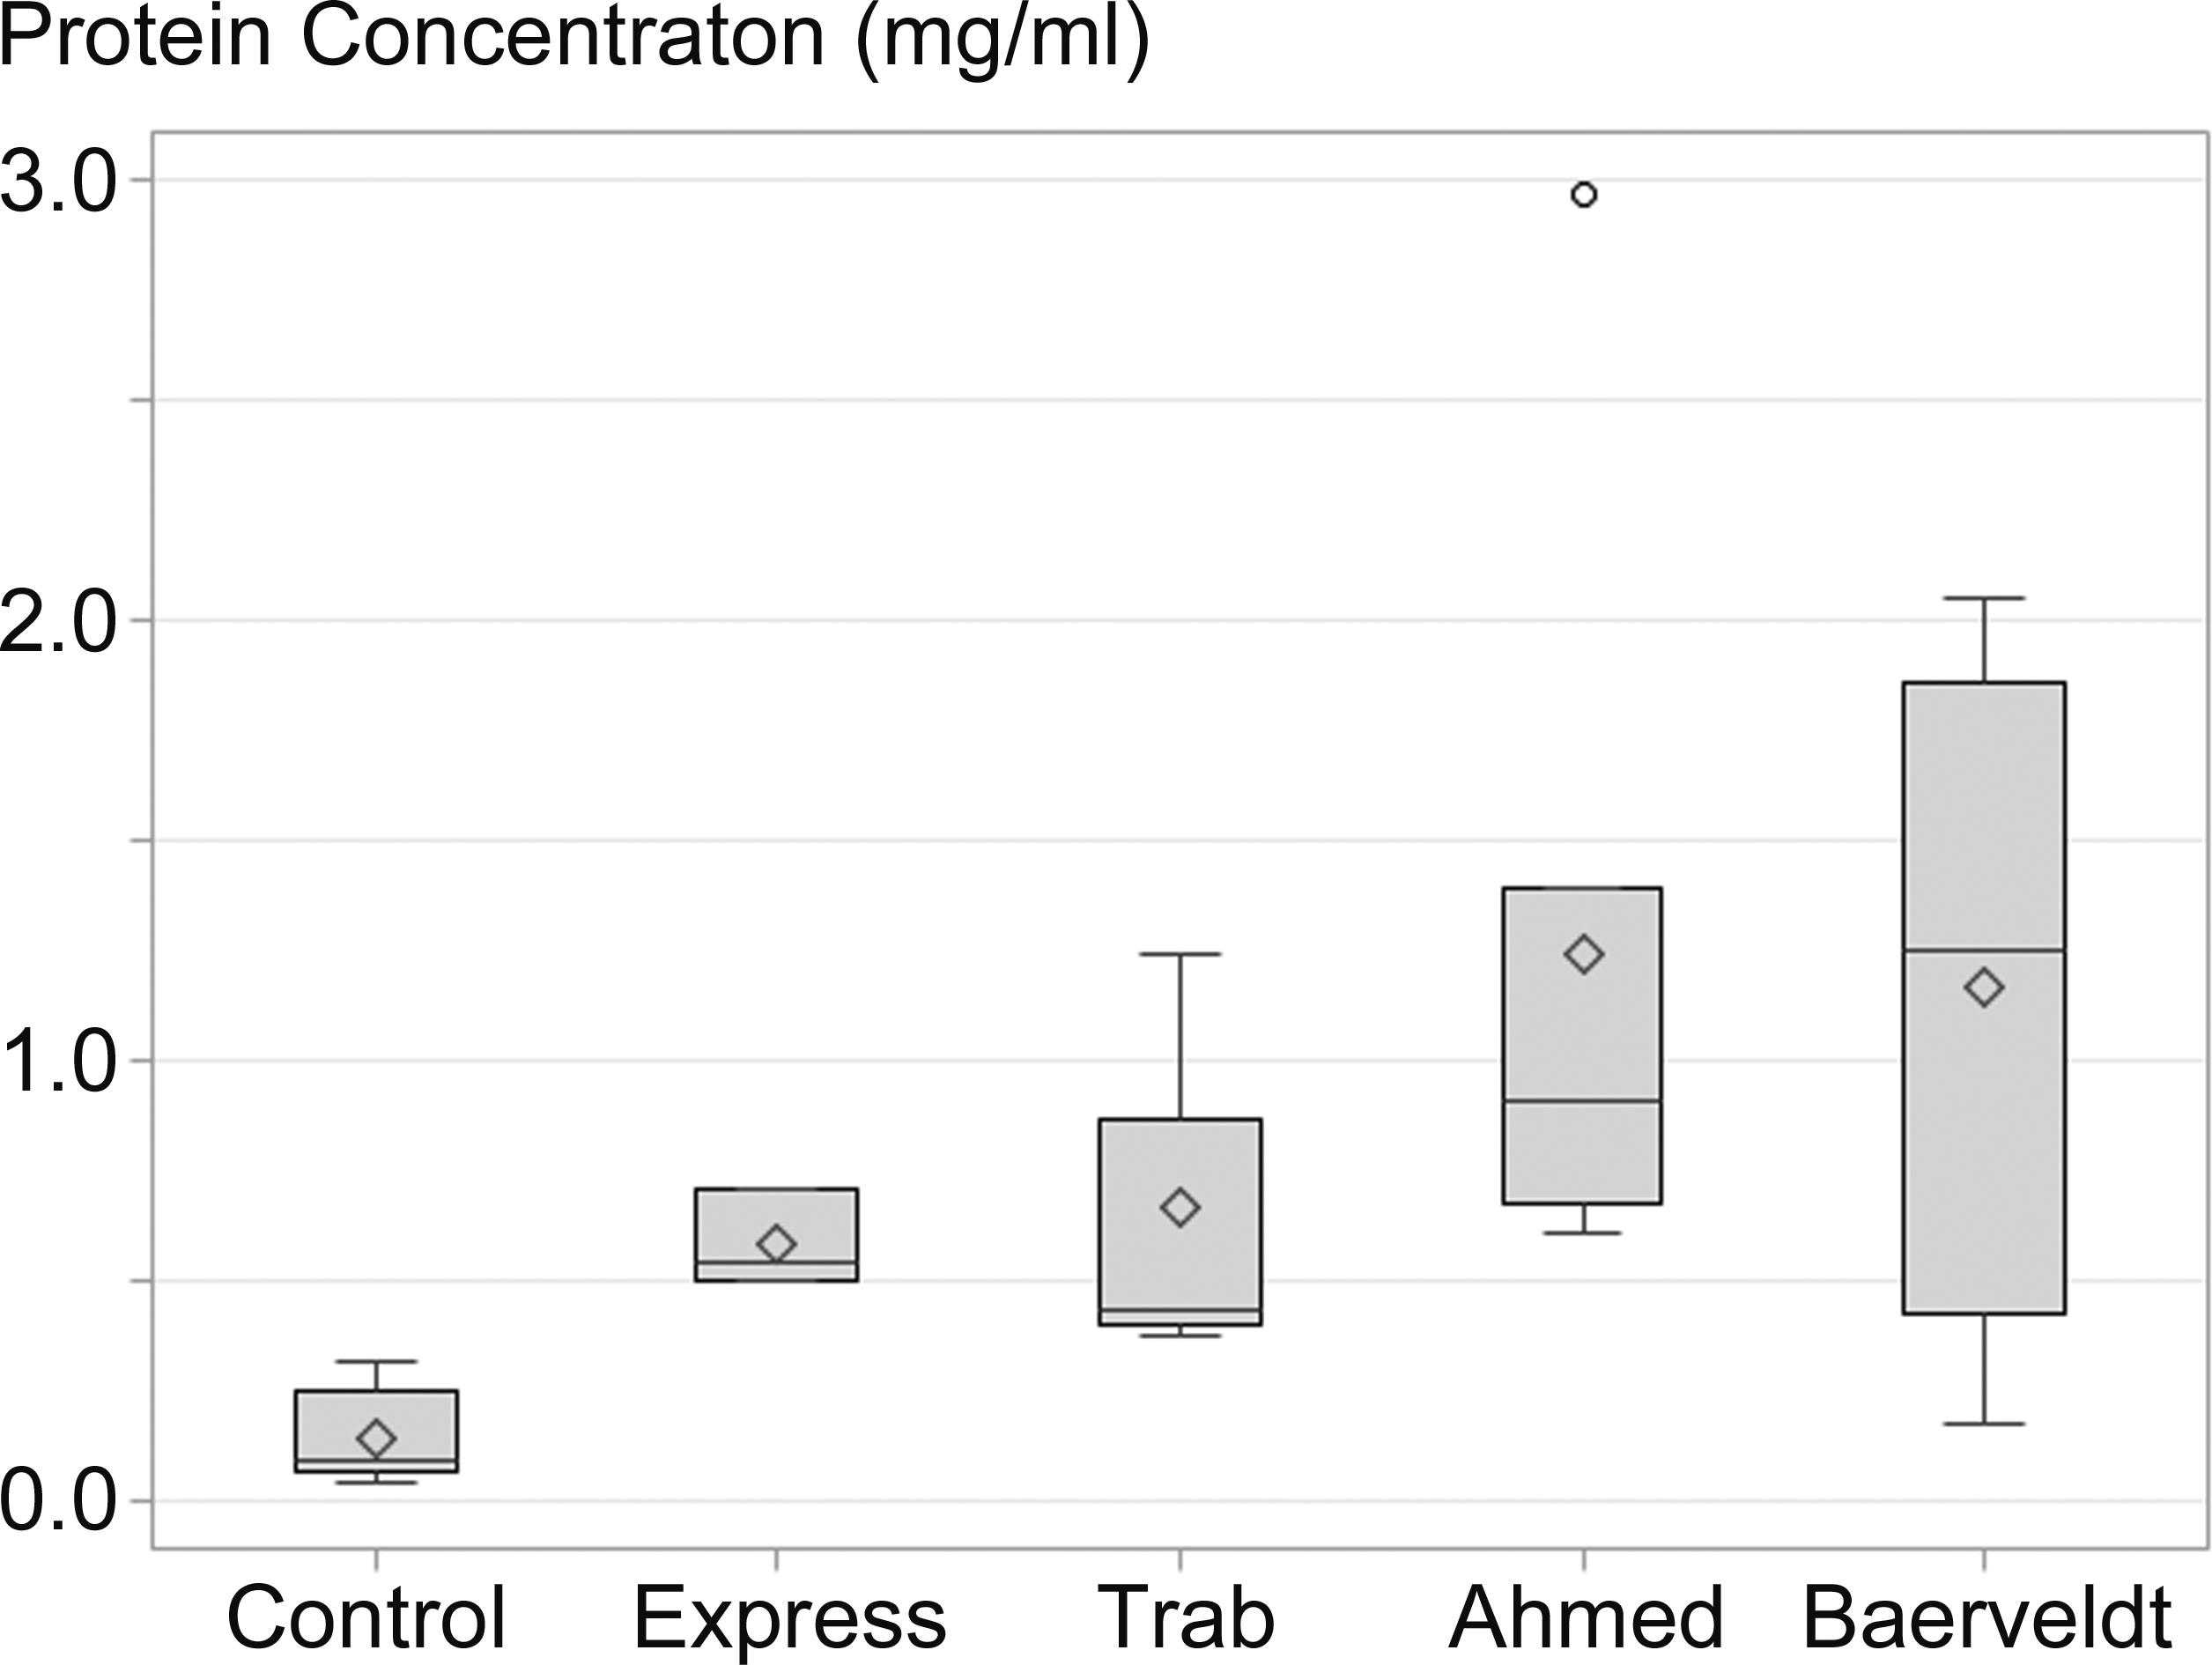
 Figure 1 of
Rosenfeld, Mol Vis 2015; 21:911-918.
Figure 1 of
Rosenfeld, Mol Vis 2015; 21:911-918.