Figure 2. Apoptosis and the expressions of PD-1 and PD-L1 on activation-induced apoptotic cells were evaluated by flow cytometry. A: Cells considered to be undergoing apoptosis were positive for Annexin V, but negative for PI (the lower right part). B: The gated cells represent the expression of Annexin V+PI-PD-1+ cells. C: The gated cells represent the expression of Annexin V+PI-PD-L1+ cells. Results of a representative experiment are shown. D: Apoptosis and the expressions of PD-1 and PD-L1 on activation-induced apoptotic lymphocytes are shown by a histogram. All
data shown represent the mean ± SD of at least three independent experiments. *p<0.05 compared with the control group. #p<0.05
compared with the DM-NDR group.
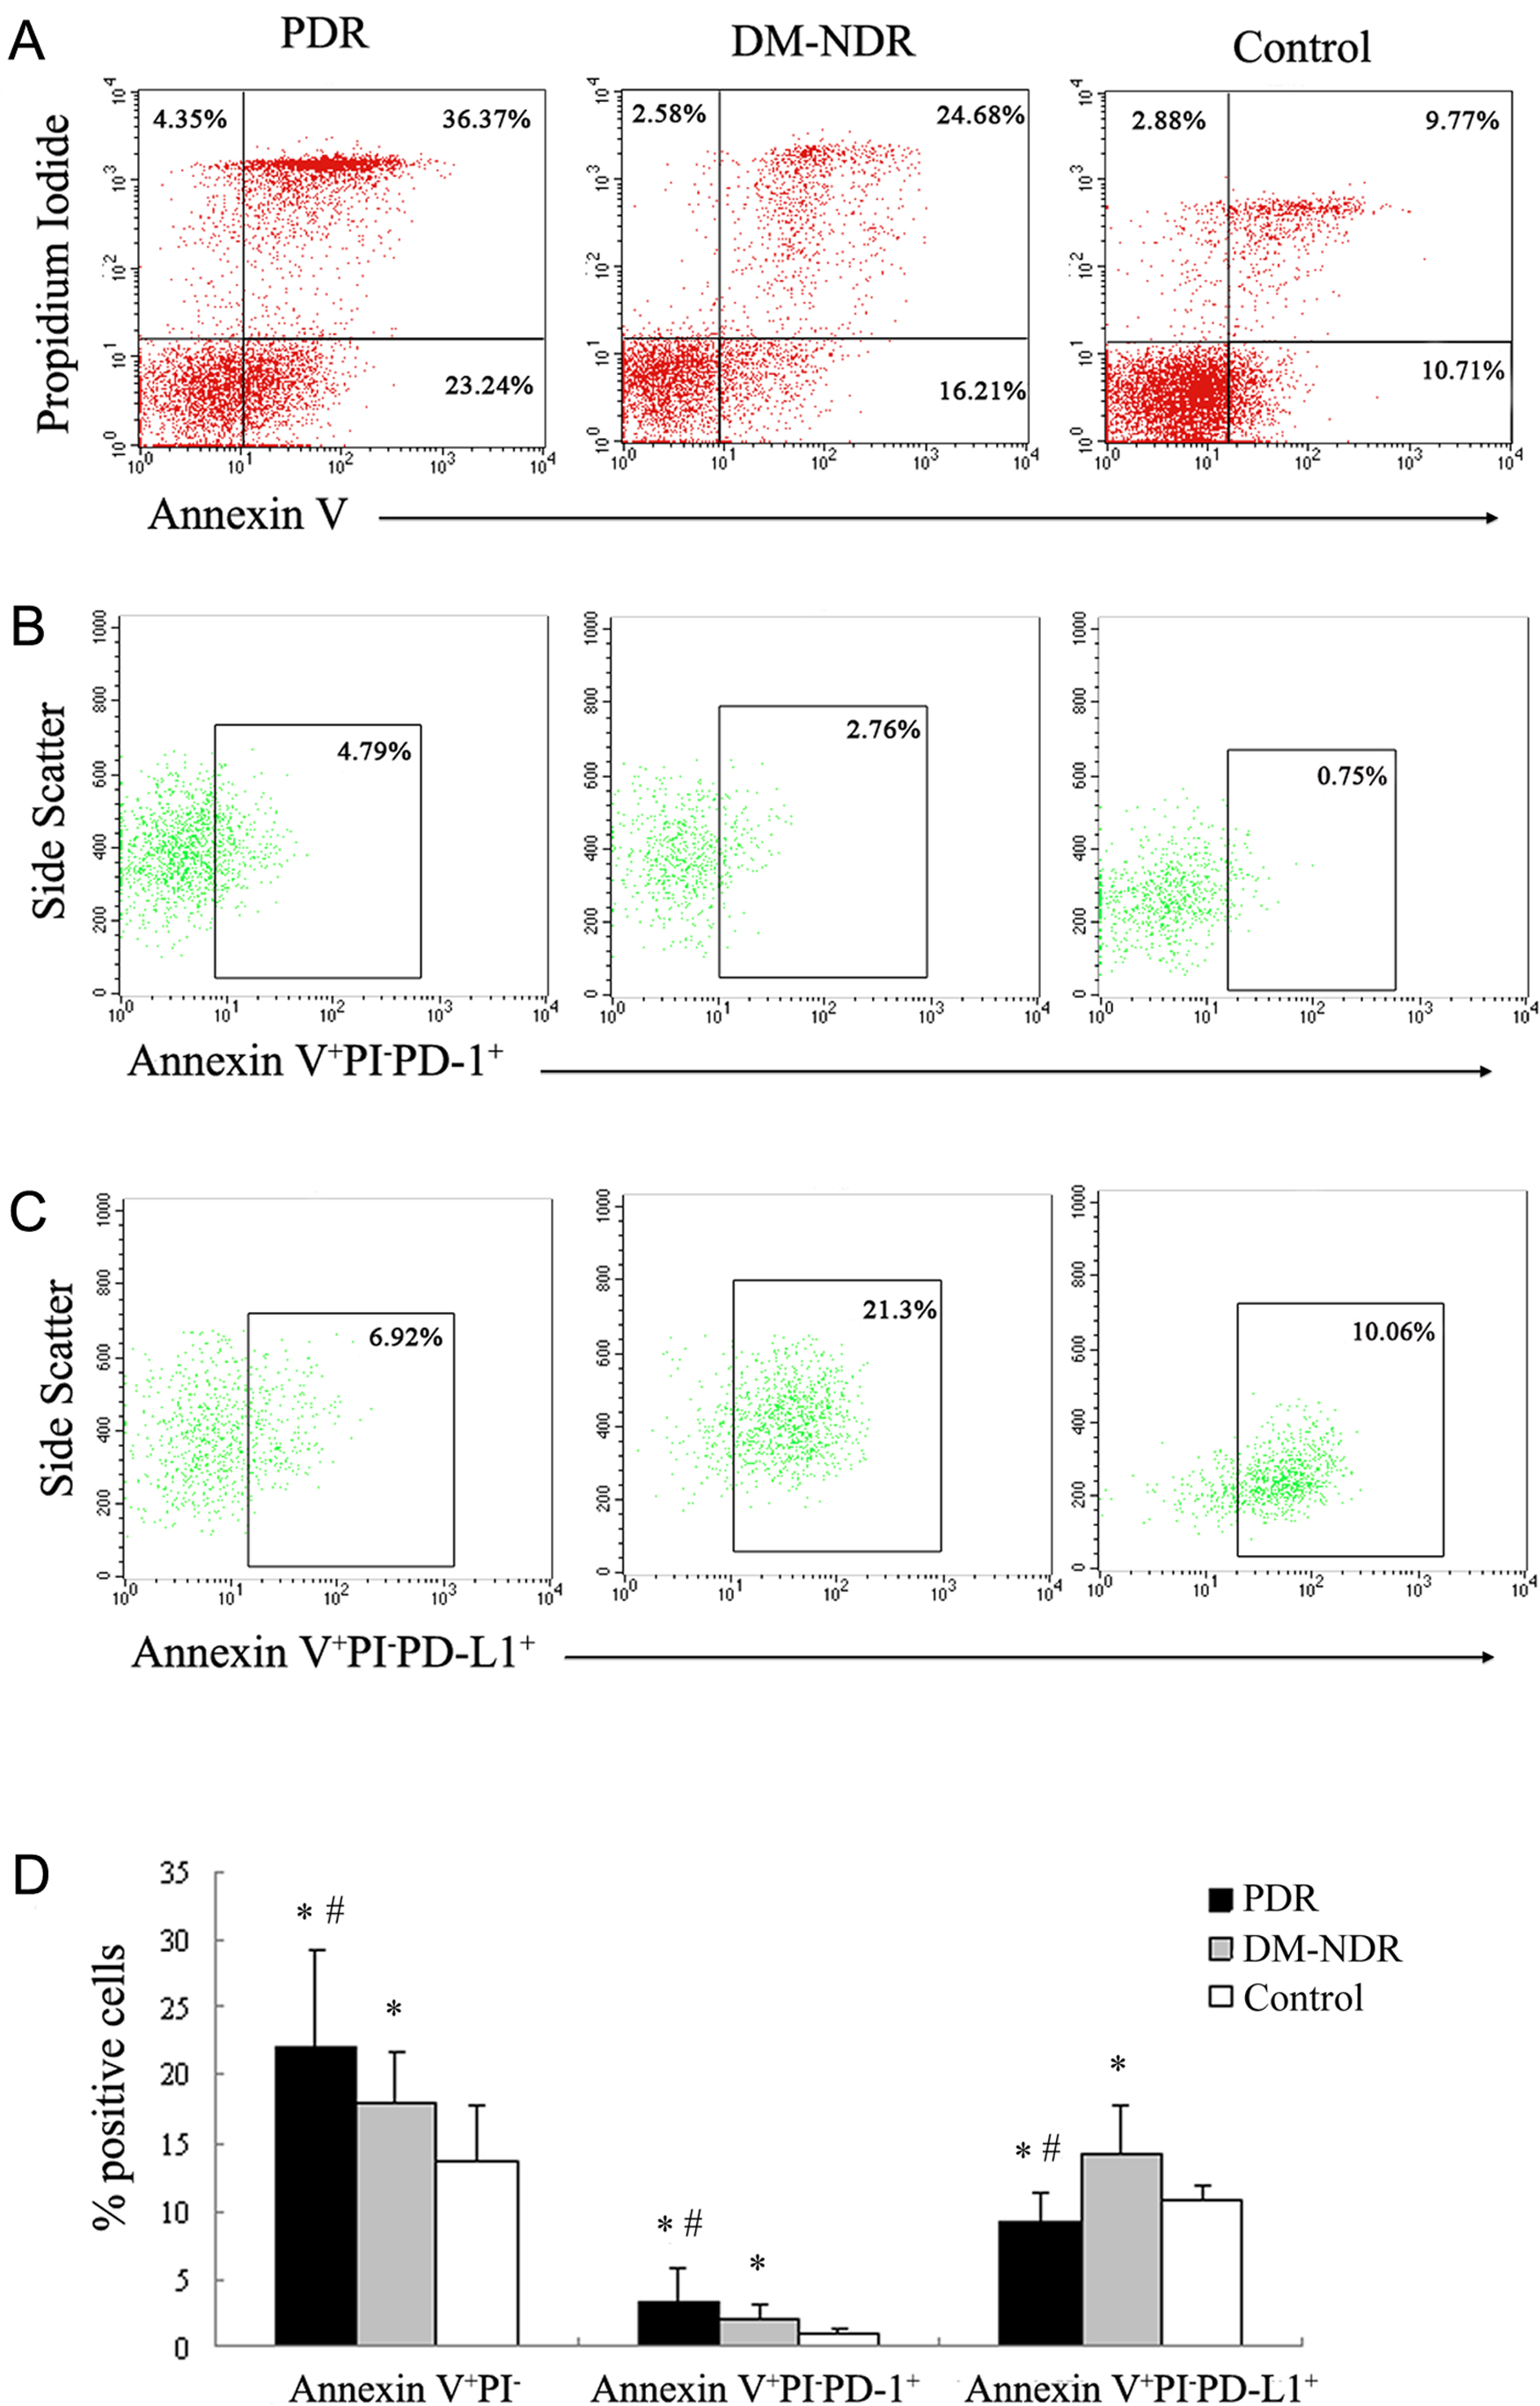
 Figure 2 of
Fang, Mol Vis 2015; 21:901-910.
Figure 2 of
Fang, Mol Vis 2015; 21:901-910.