Figure 1. The frequencies of PD-1- and PD-L1-positive cells on lymphocytes were evaluated by flow cytometry. All data shown represent
the mean ± SD of at least three independent experiments. *p<0.05 compared with the control group; #p<0.05 compared with the
DM-NDR group.
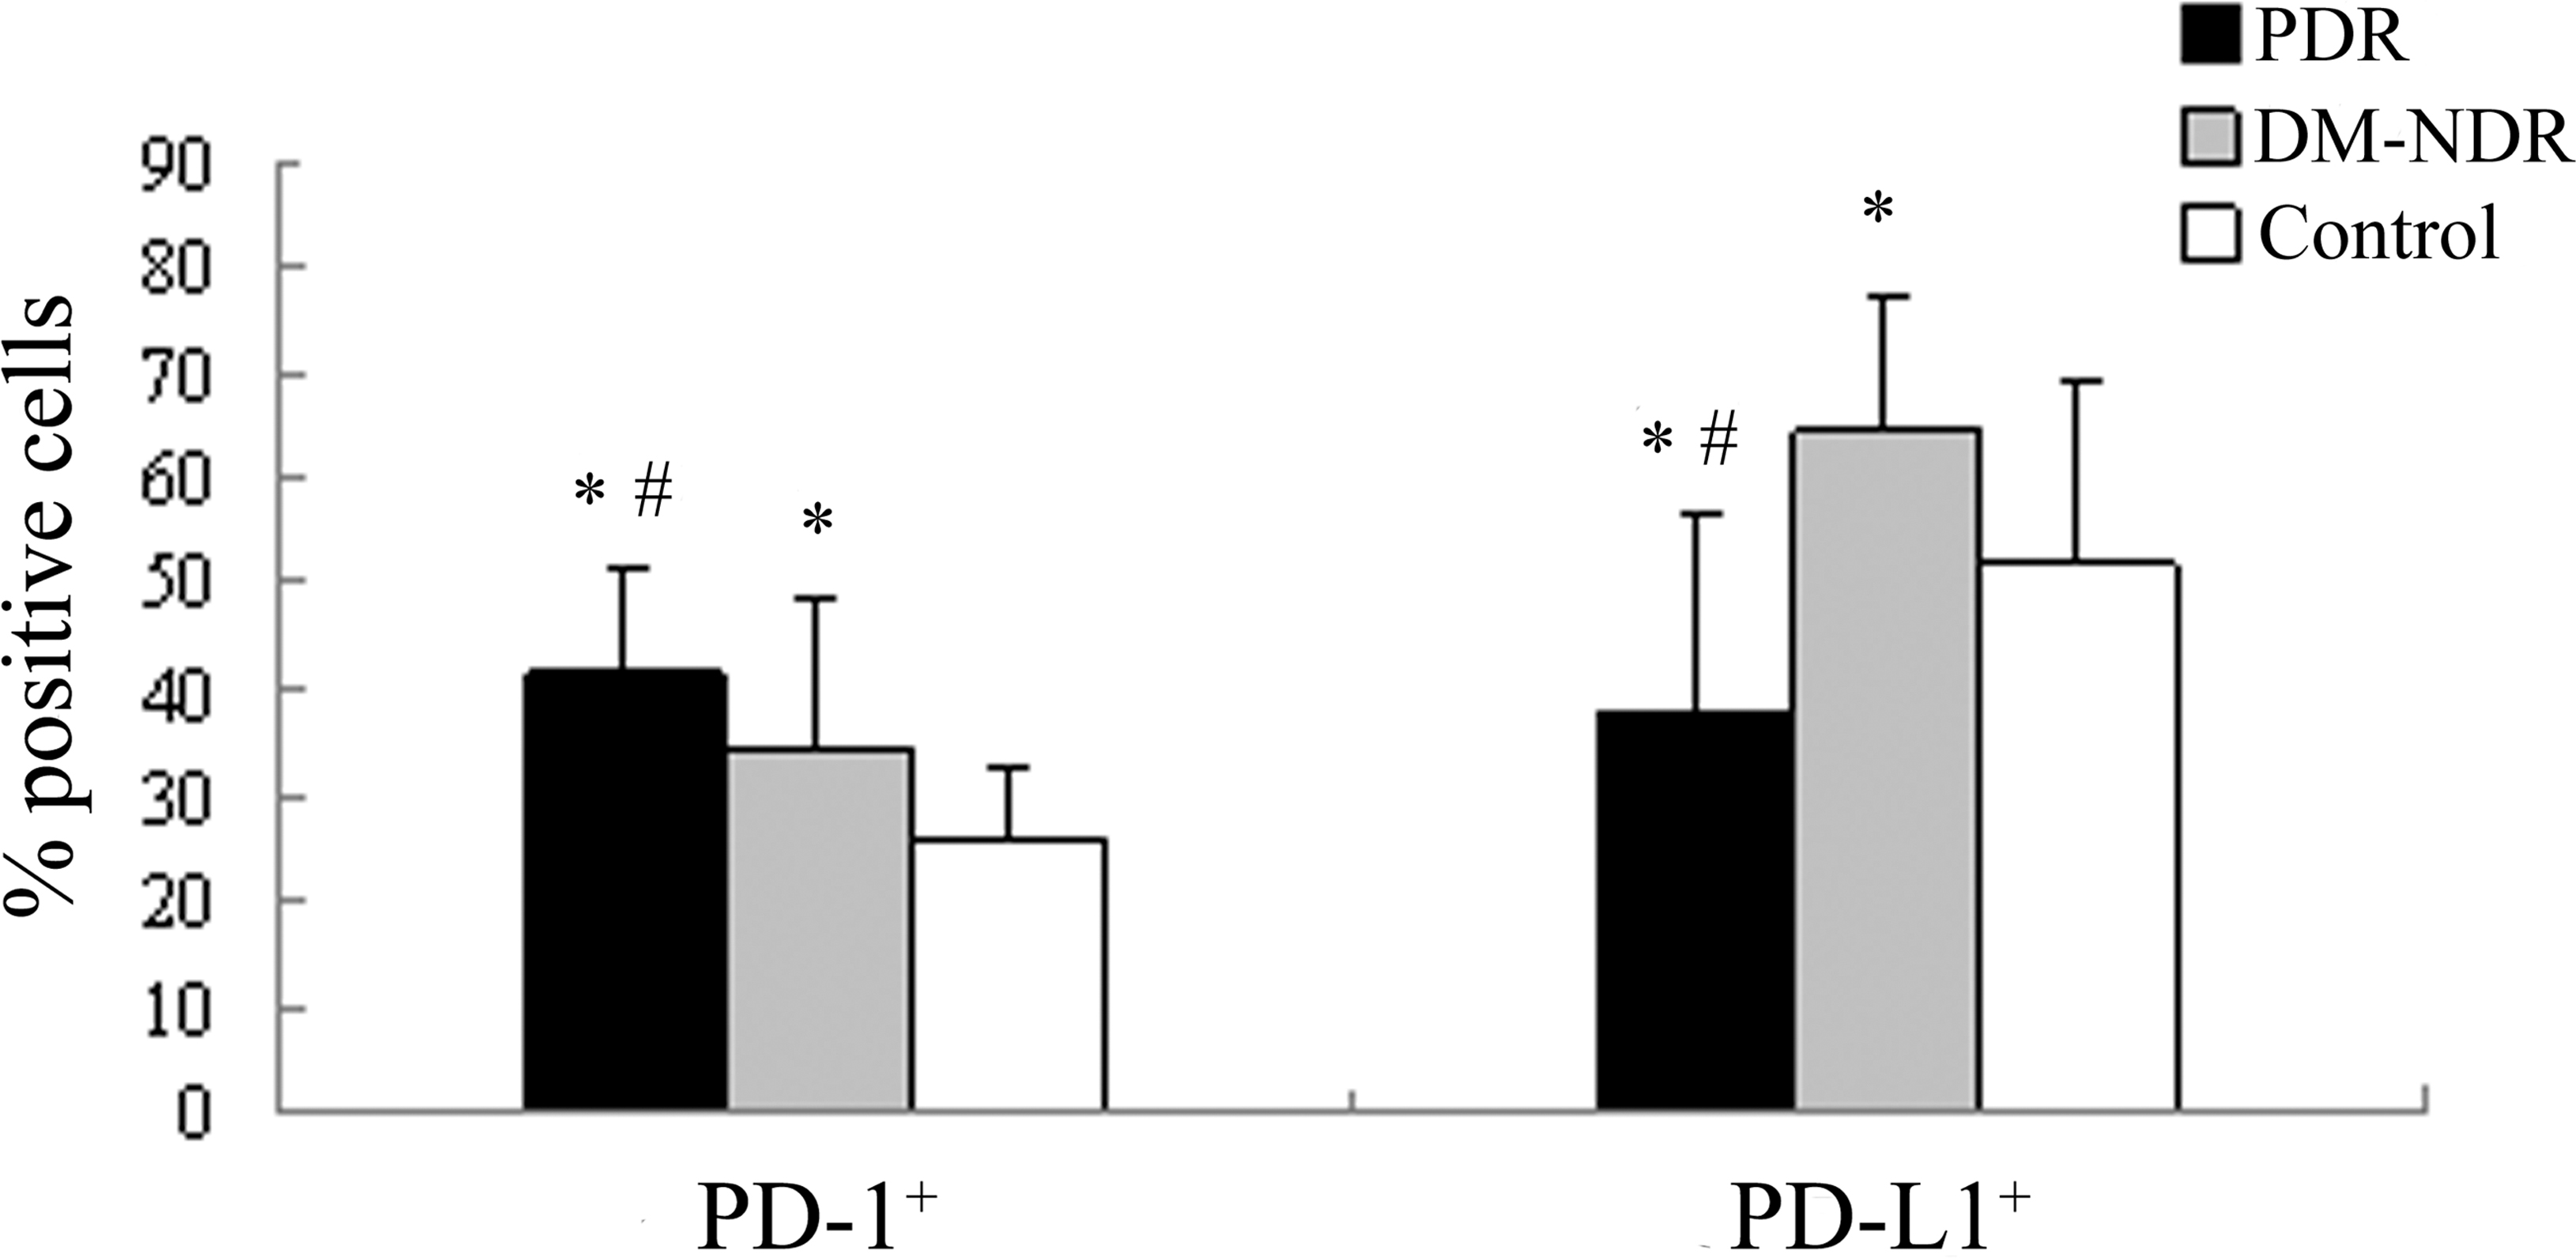
 Figure 1 of
Fang, Mol Vis 2015; 21:901-910.
Figure 1 of
Fang, Mol Vis 2015; 21:901-910.