Figure 2. Photobiomodulation reduced ROS production but did not change the cell viability or mitochondrial membrane potential. A: Cell viability was measured using a WST-8 assay kit. Cell viability was reduced by oxidative stress, and photobiomodulation
did not change the cell viability compared to the H2O2 only group. In this point, we performed the statistical analysis between H2O2 only treated group and photobimodulation group. B: ROS production was measured using the general oxidative stress indicator, CM-H2DCFDA. Oxidative stress significantly increased ROS generation, and photobiomodulation reduced ROS production. NAC used as
a positive controls also reduced ROS production compared to the H2O2 only group. In this point, we performed the statistical analysis between H2O2 only treated group and photobimodulation group. C: Mitochondrial membrane potential was evaluated using JC-1 dye. Green fluorescence indicates the low mitochondrial membrane
potential, and red fluorescence indicates the low mitochondrial membrane potential. Oxidative stress and photobiomodulation
did not change the mitochondrial membrane potential. Scale bar=500 μm. The data are expressed as means ± SEM (n=5 or 6) *p<0.05,
**p<0.01 versus the H2O2 only group. In this point, we performed the statistical analysis between H2O2 only treated group and photobimodulation group. PBM: photobiomodulation; NAC: N-acetylcysteine.
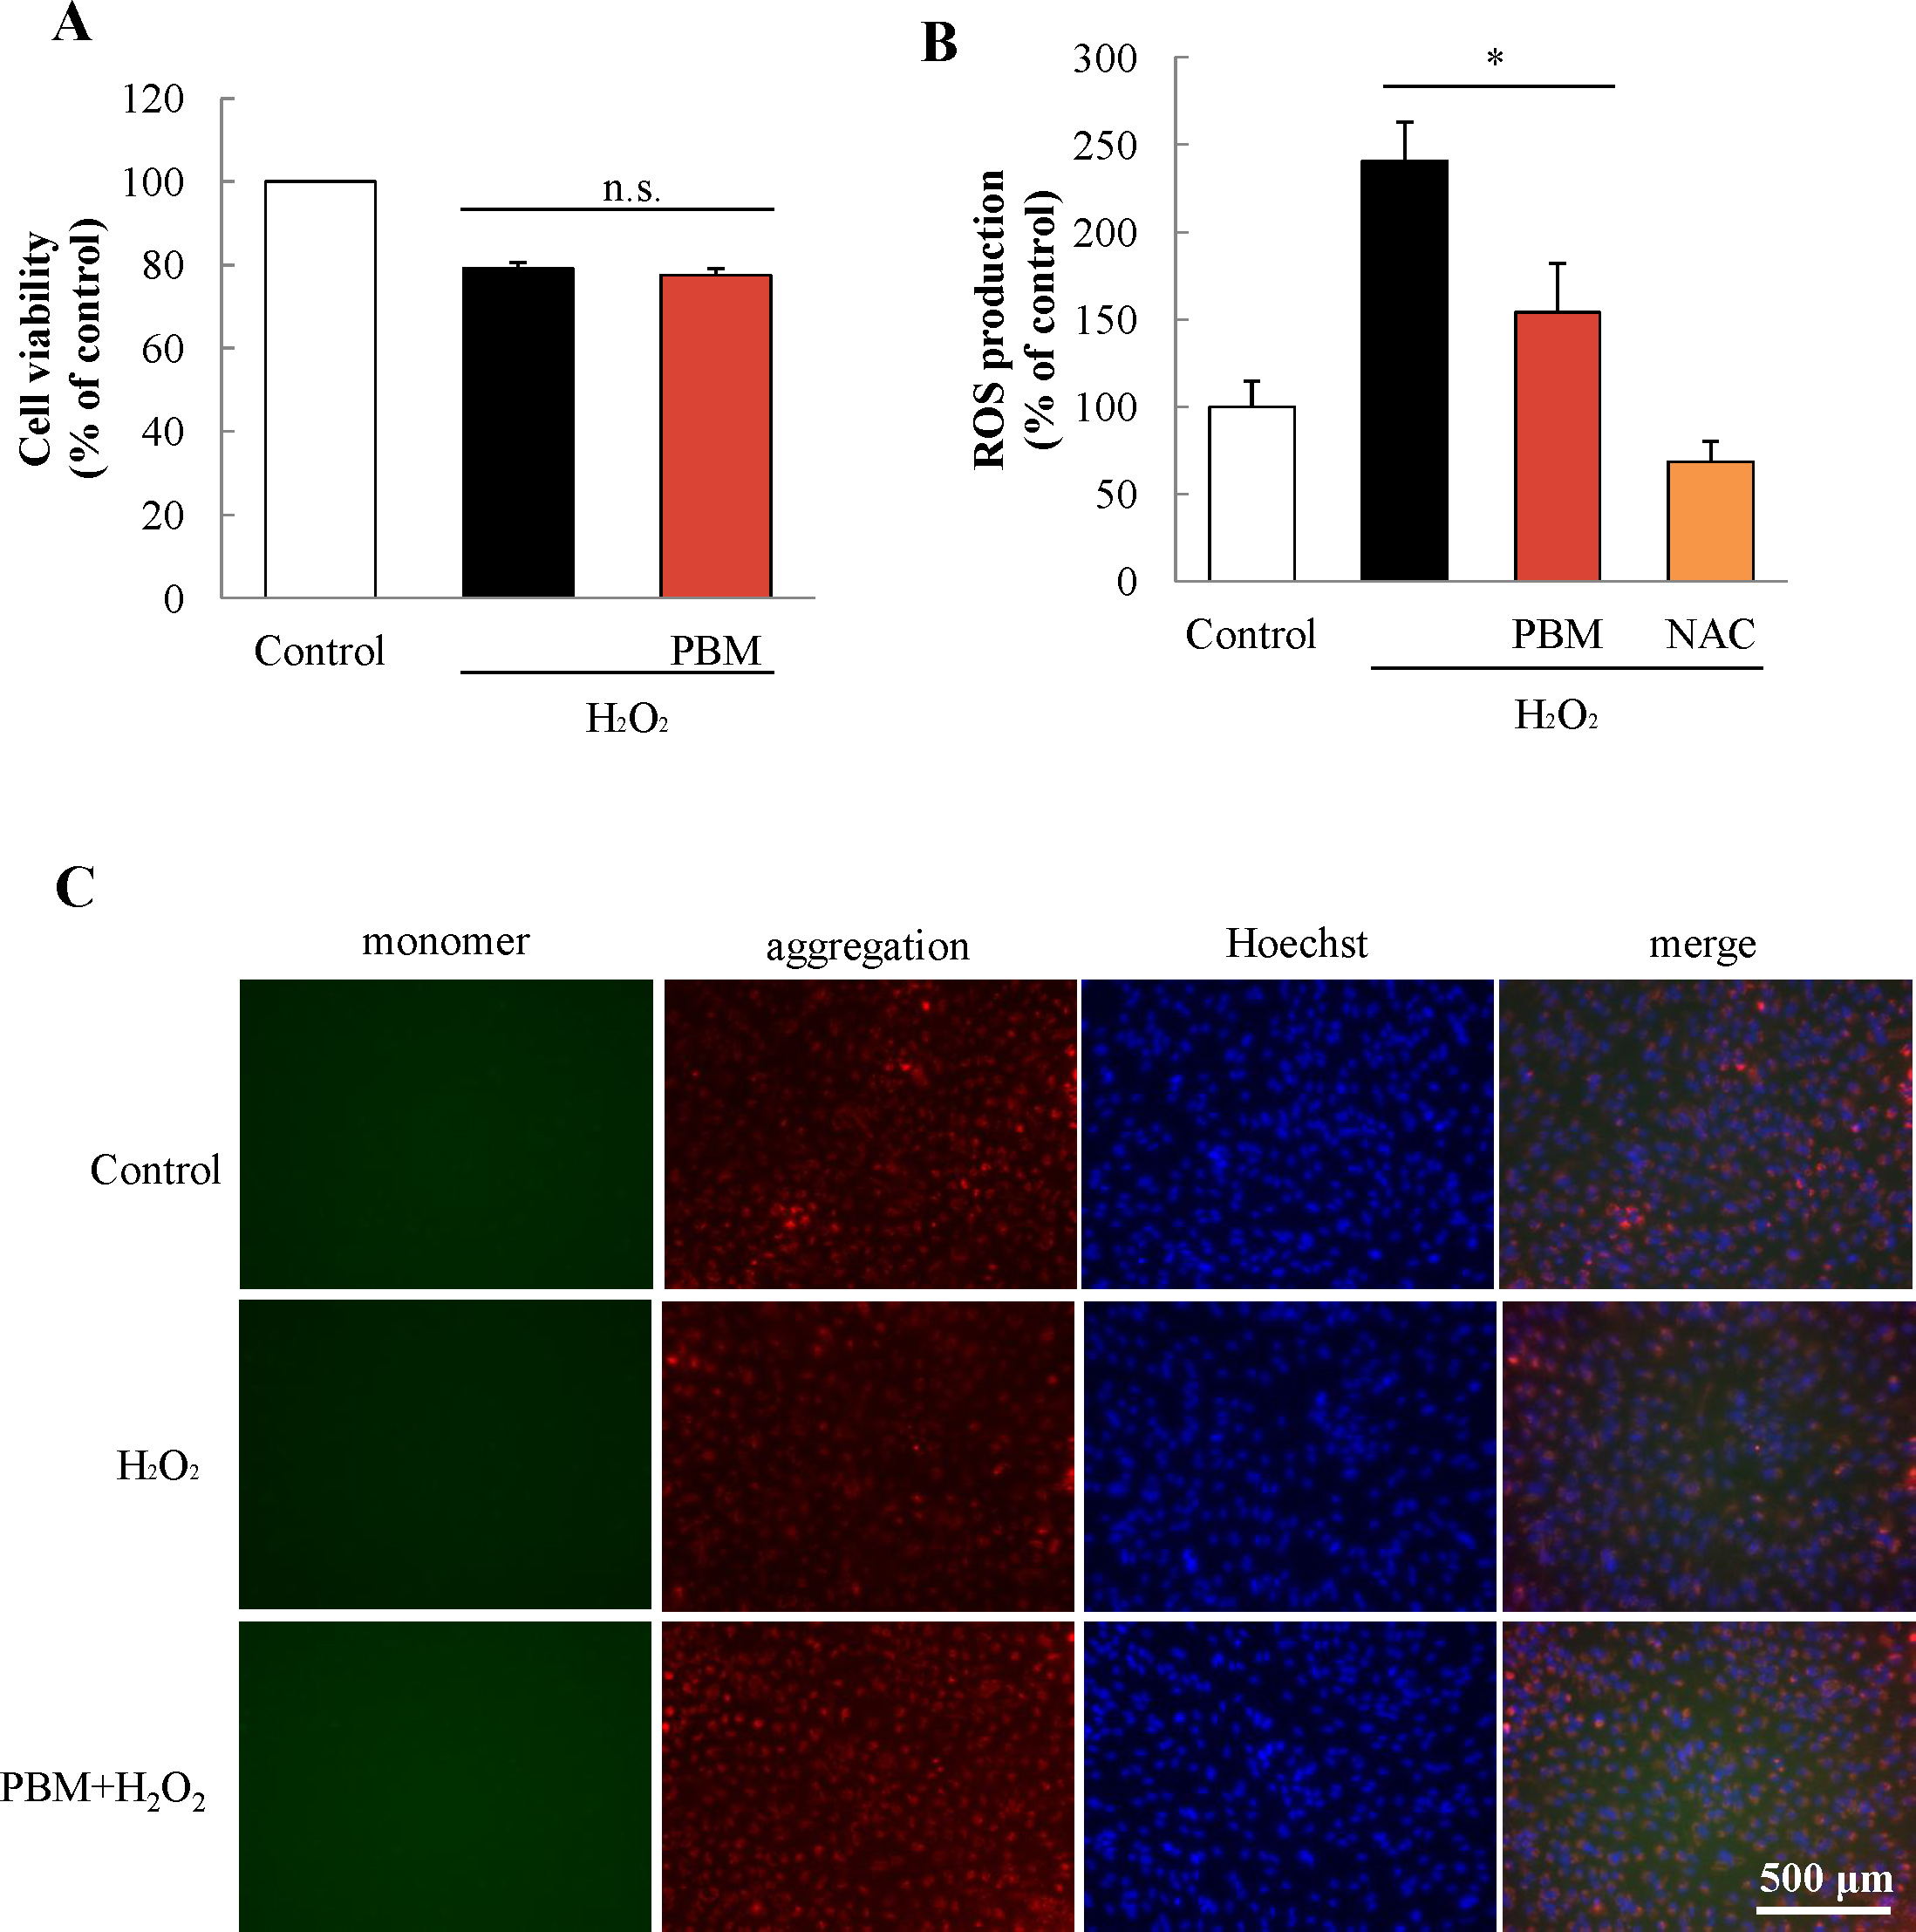
 Figure 2 of
Fuma, Mol Vis 2015; 21:883-892.
Figure 2 of
Fuma, Mol Vis 2015; 21:883-892.