Figure 3. Lower macular sensitivity is shown with age. Microperimetric map image (MAIA, Topcon) of II:1 and son IV:2 (from family RPT65)
who show normal sensitivity in the central macula (green area) and decreased sensitivity at the peripheral macula (red area).
Thirty-six stimulus locations covering the central 10° field were tested.
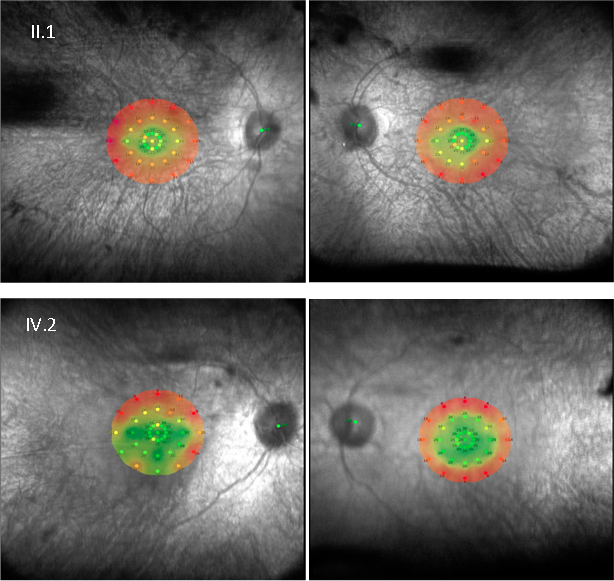
 Figure 3 of
de Sousa Dias, Mol Vis 2015; 21:857-870.
Figure 3 of
de Sousa Dias, Mol Vis 2015; 21:857-870.