Figure 6. Autophagy regulation of stem cells. Quantitative PCR analysis of autophagy markers LC3A, LC3B, ATG7, RAB7, LAMP1, and LAMP2 was performed on day 0 and day 14. A: Relative mRNA expression of autophagy genes on 0 day culture of the limbal, conjunctival, and oral explant cultures. B: Gene expression of autophagy genes in the day 14 limbal, conjunctival, and oral cultures. Results were calibrated with β-actin.
All experiments were performed in triplicate using six samples per group (limbal, conjunctival, and oral). Significance denoted,
p *<0.05, **<0.01, ***<0.005.
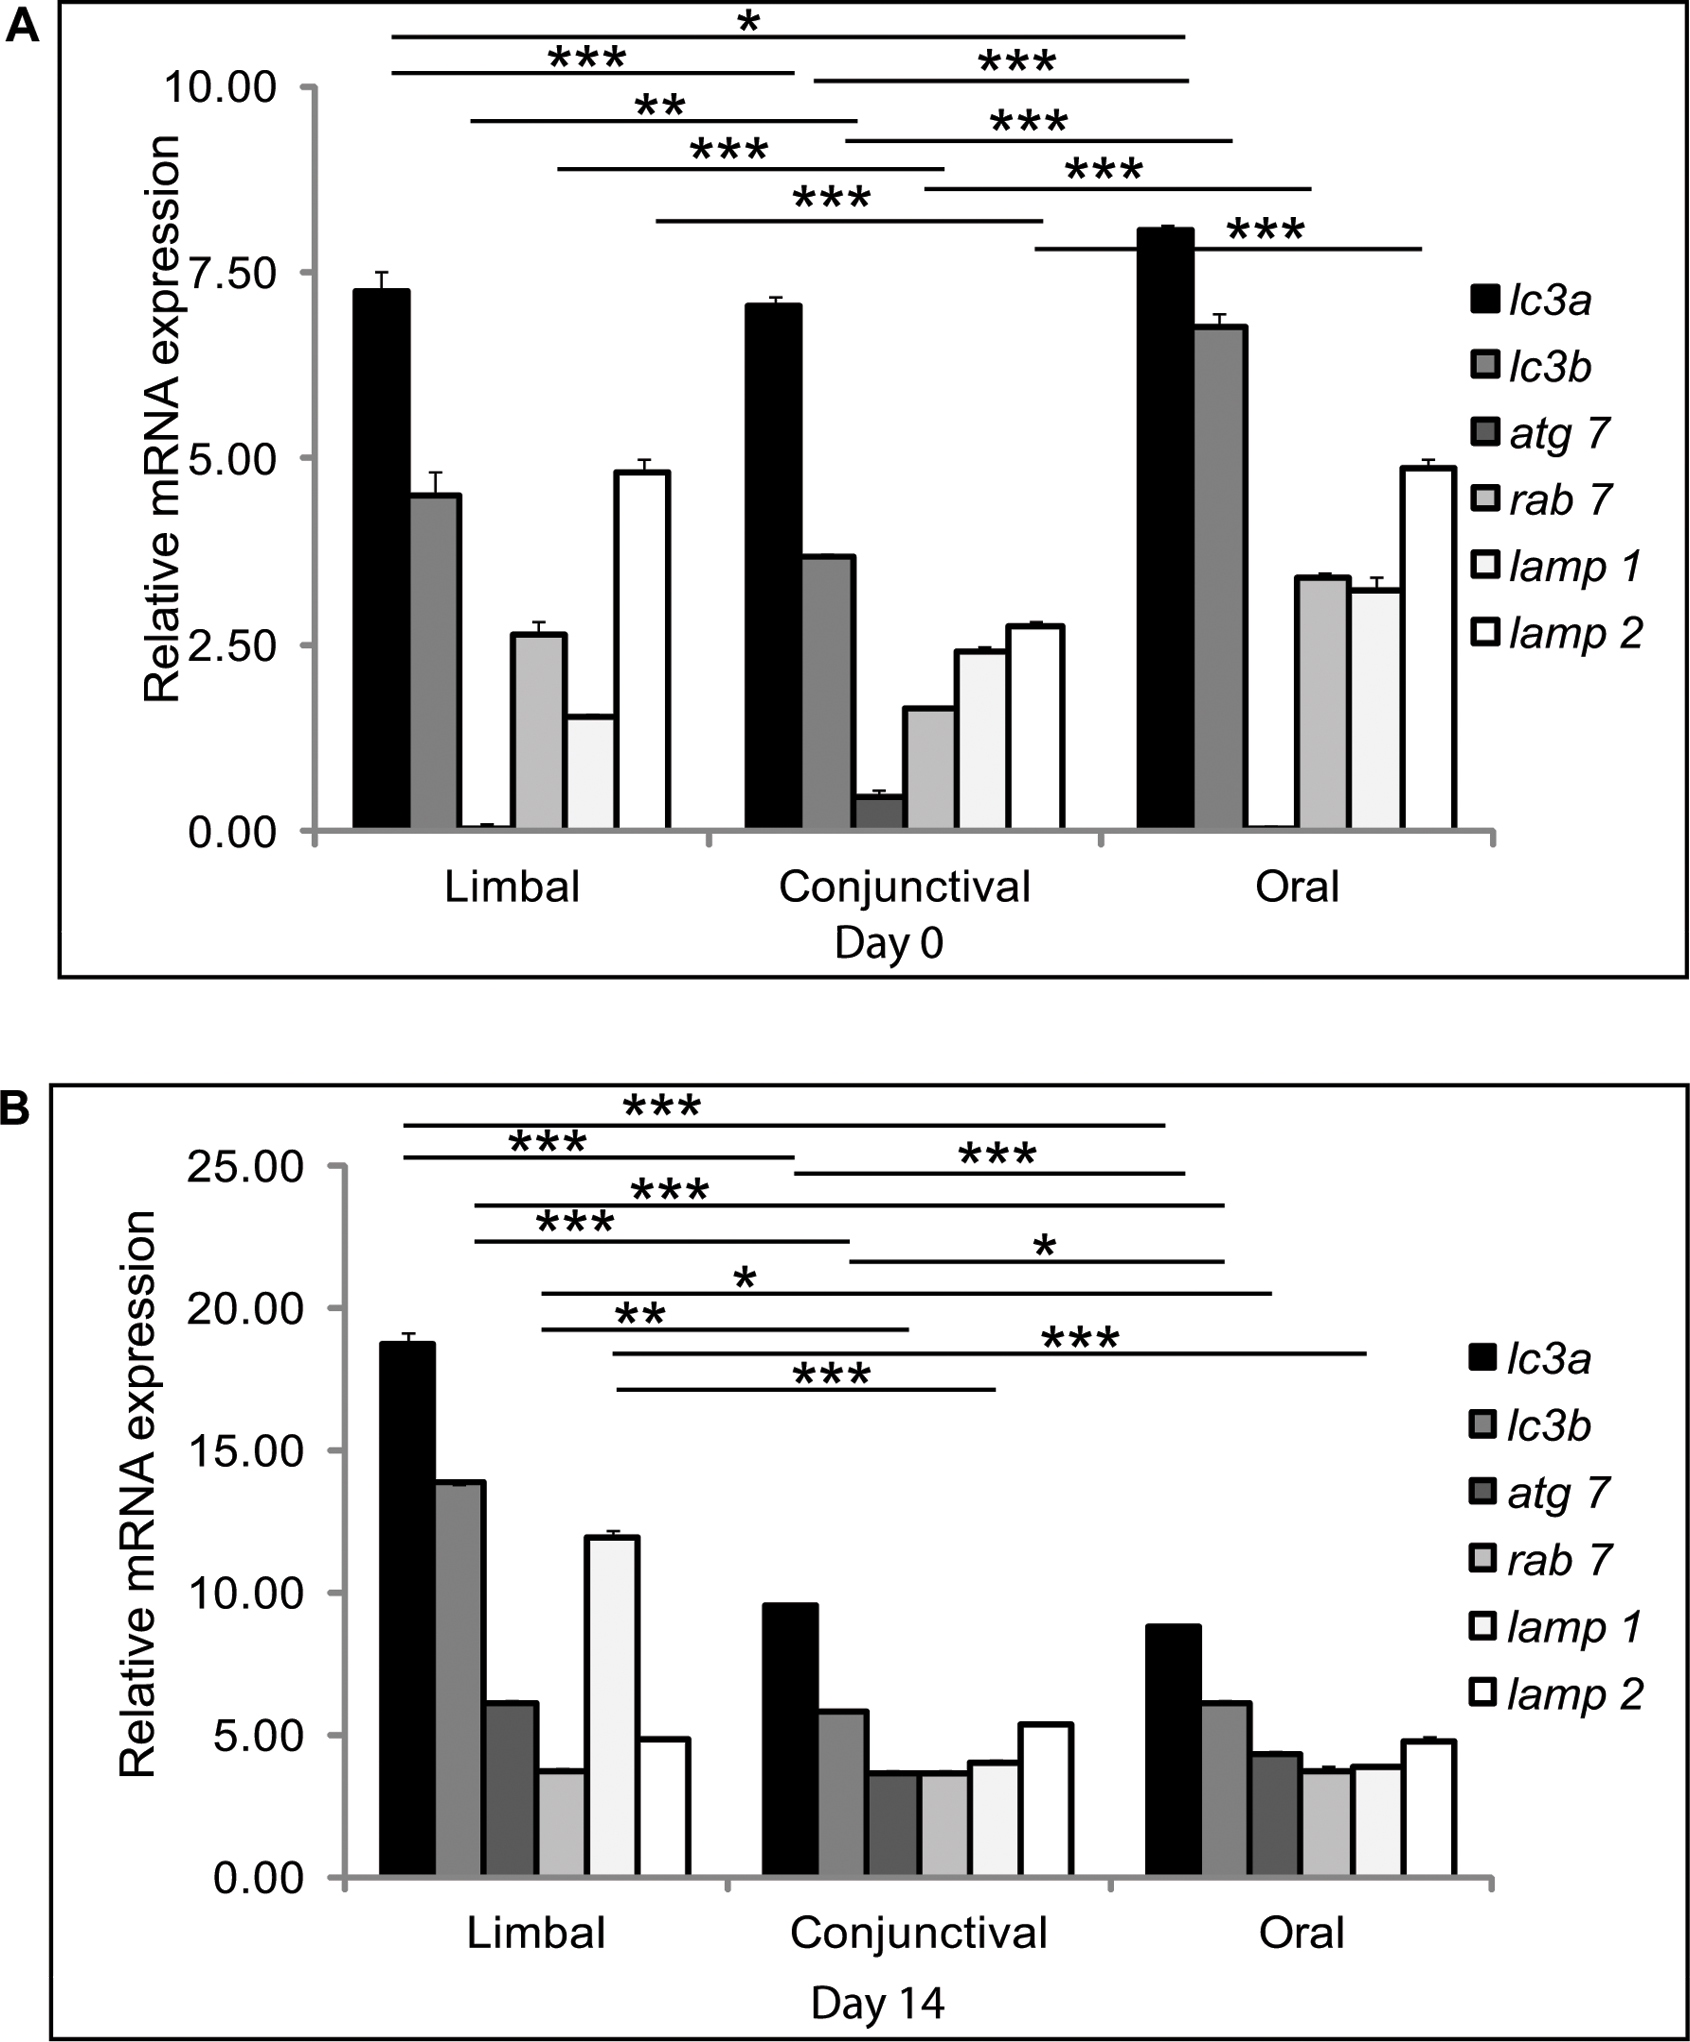
 Figure 6 of
Dhamodaran, Mol Vis 2015; 21:828-845.
Figure 6 of
Dhamodaran, Mol Vis 2015; 21:828-845.