Figure 4. Putative limbal stem/progenitor cell marker expression p63α. A: Quantitative PCR expression levels of ΔNp63 in limbal, conjunctival, and oral cultured cells from day 0 and day 14 cultures. Results were calibrated with β-actin. All
experiments were performed in triplicate using six samples per group (limbal, conjunctival, and oral). B: Representative fluorescent activated cell sorting (FACS) analysis of the p63α-positive population in the limbal, conjunctival,
and oral cultured cells from day 14 cultures. C: Summarizing graph represents the results of the FACS analysis of p63α in the limbal, conjunctival, and oral cultured cells,
performed in triplicate. Significance denoted, p *<0.05, **<0.01, ***<0.005.
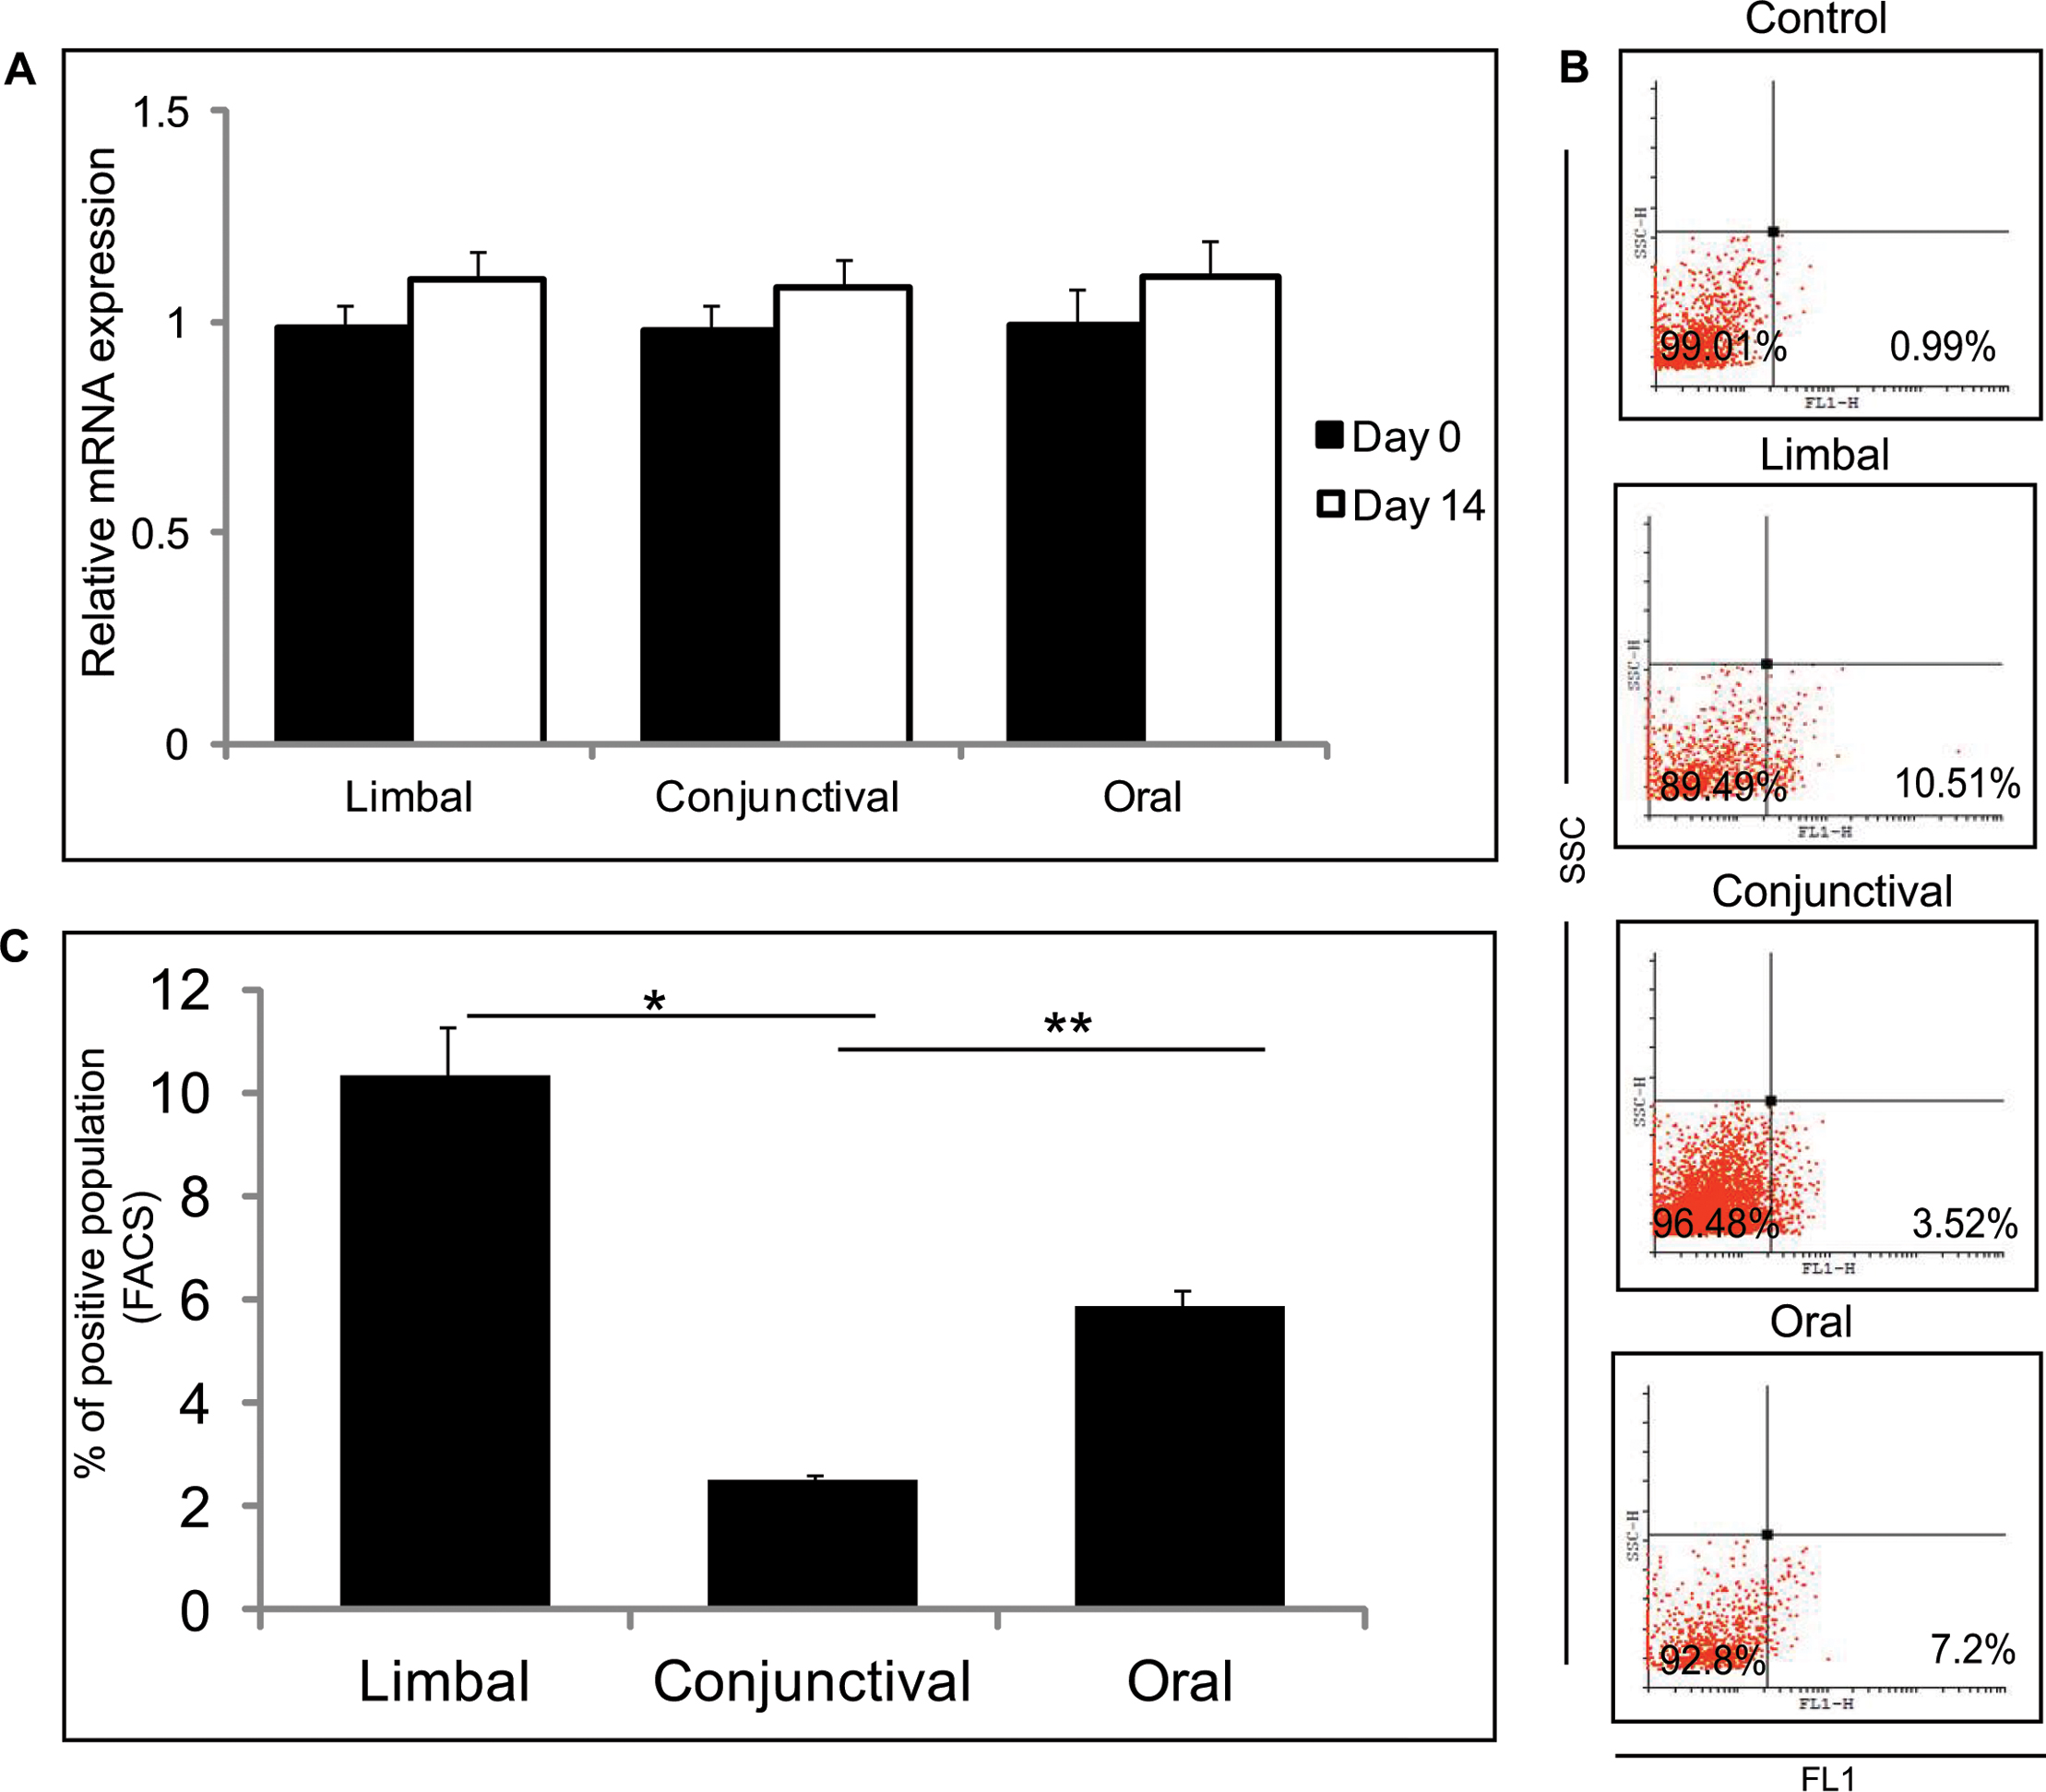
 Figure 4 of
Dhamodaran, Mol Vis 2015; 21:828-845.
Figure 4 of
Dhamodaran, Mol Vis 2015; 21:828-845.