Figure 1. Expression of pluripotent markers. A: Quantitative PCR results for day 14 cultured limbal, conjunctival, and oral cells for OCT4, SOX2, and NANOG mRNA expression. Results were normalized with β-actin. All experiments were performed in triplicate using six samples per
group (limbal, conjunctival, and oral). B: Graphical representation of the fluorescent activated cell sorting (FACS) data obtained for three different tissue origins,
showing positive staining with antibodies against OCT4, SOX2, and NANOG. Statistical significance denoted, p *<0.05, **<0.01,
***<0.005.
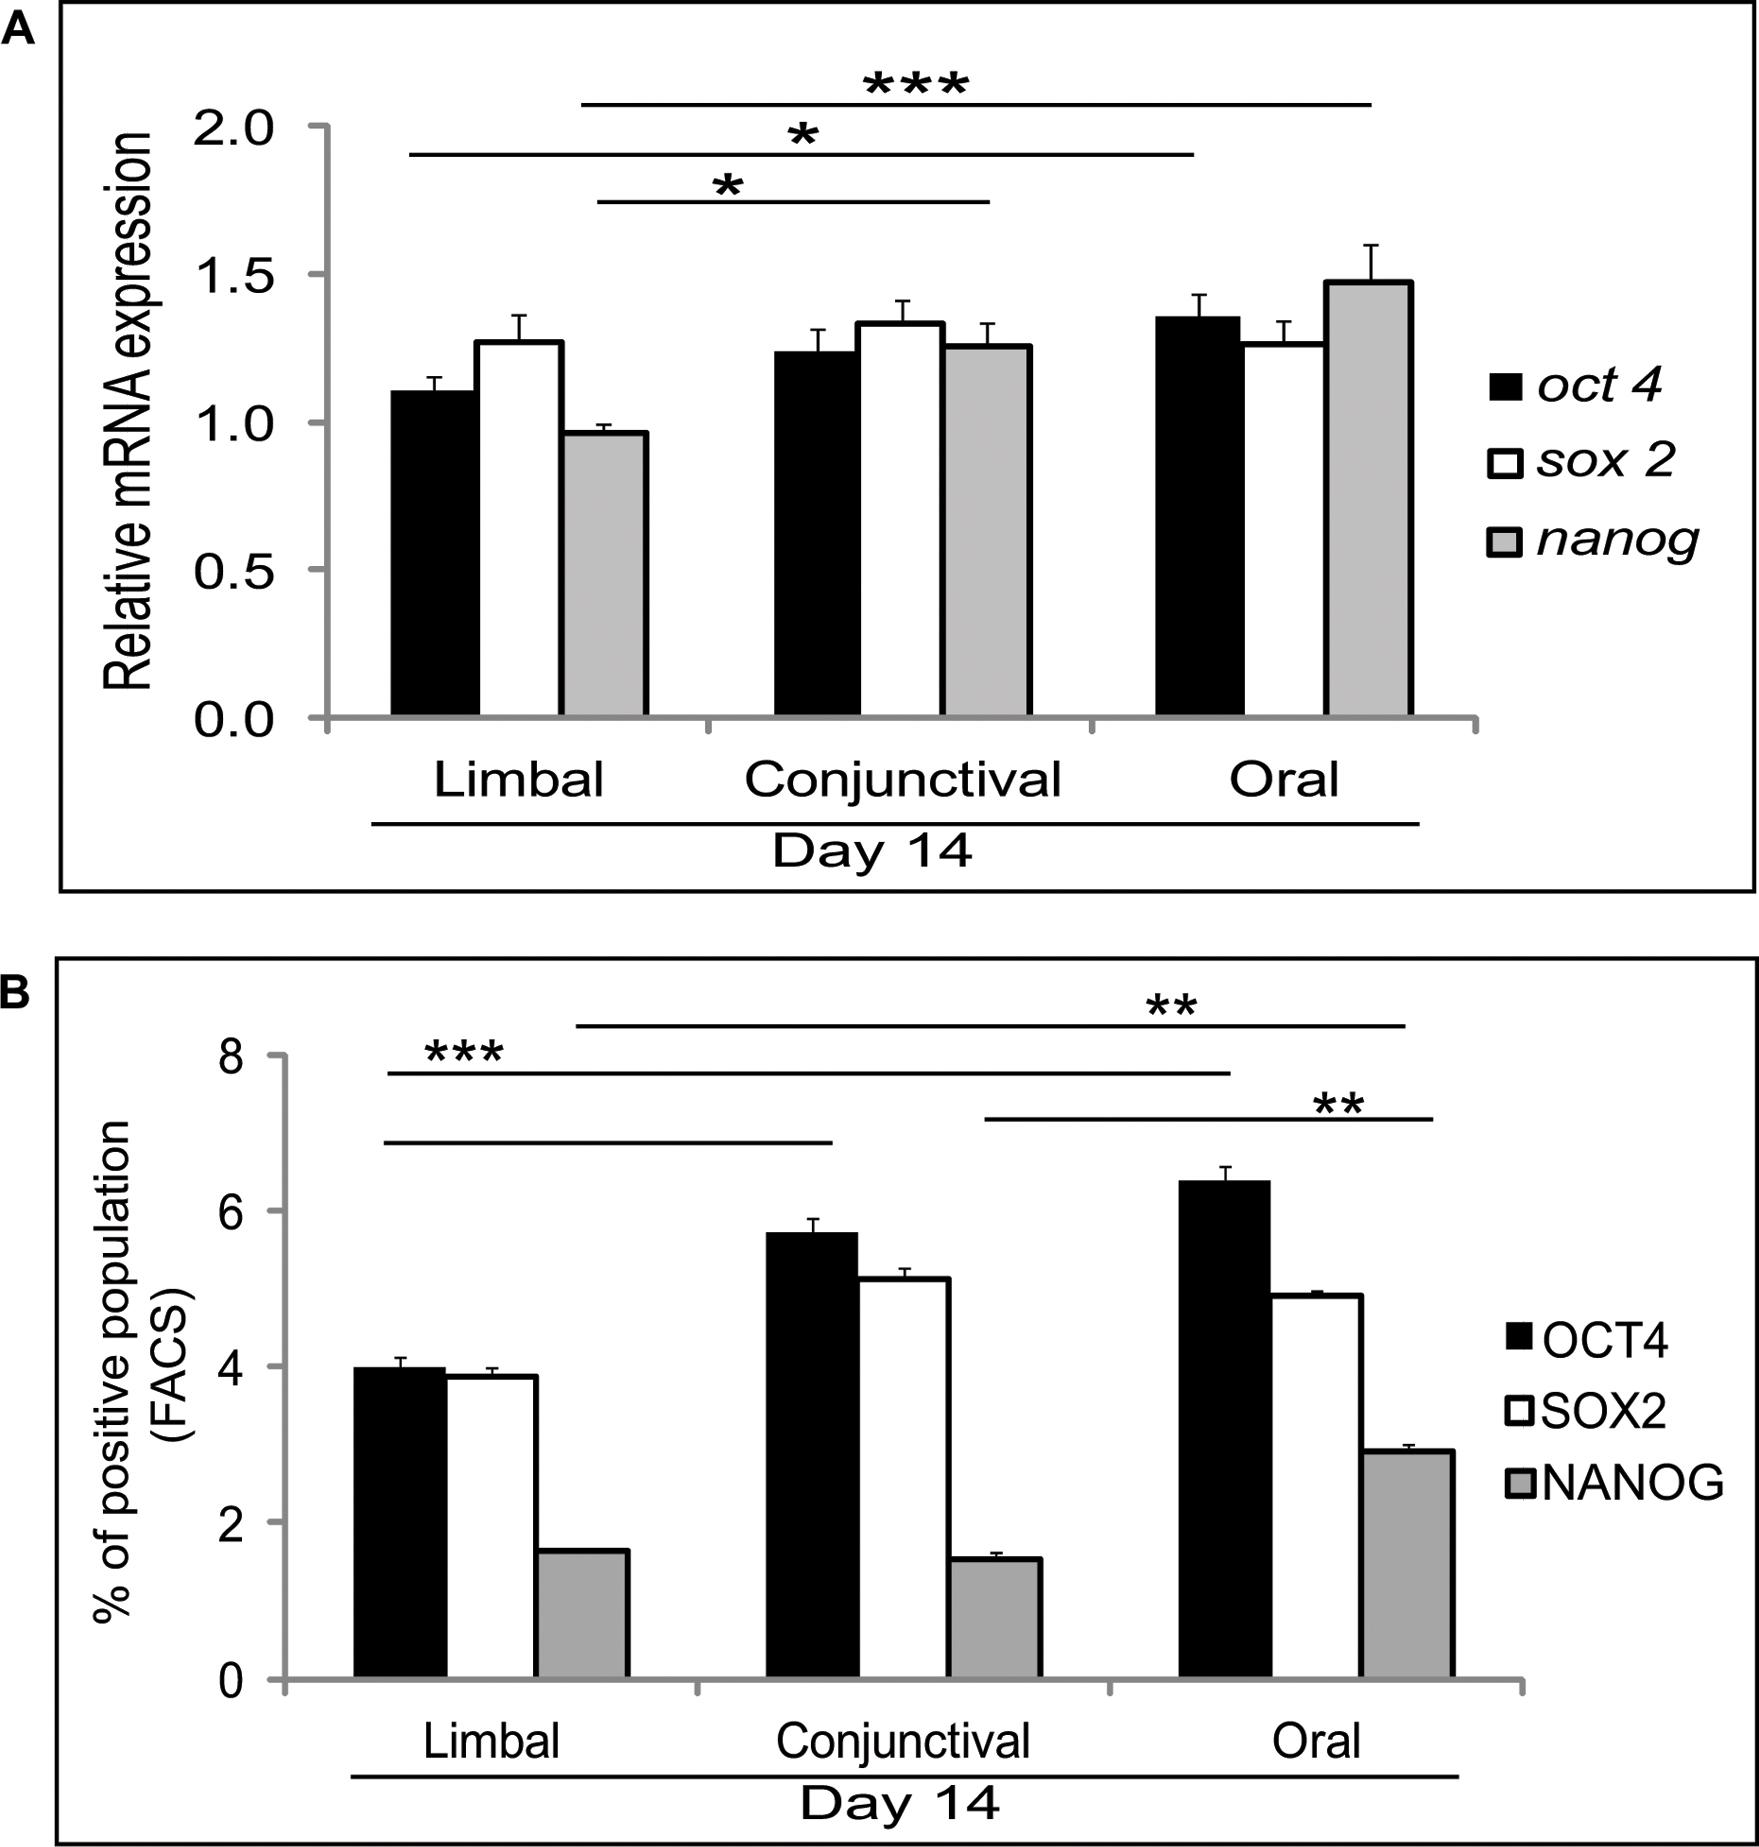
 Figure 1 of
Dhamodaran, Mol Vis 2015; 21:828-845.
Figure 1 of
Dhamodaran, Mol Vis 2015; 21:828-845.