Figure 4. Immunocytochemical detection of cone opsin. Images were always taken from the retinal area with the highest density of labeled
cones, typically in the mid-periphery of the retina. A: Examples of S-opsin staining in C3H/HeOu retinas demonstrate the progressive loss of cone outer segments and a concomitant
accumulation of S-opsin in the cell bodies. One misshaped outer segment (clear arrow) and one soma without outer segments (OS) are indicated (solid arrow). Age, in weeks, is indicated in the top right of every panel. Scale bar=50 µm. B, C: S-opsin staining in wild-type C3H-Pde6b+ (B) and FVB-Pde6b+ (C) retinas were similar. D: Summary graph of OS counts in rd1 C3H/HeOu and FVB/N mice relative to the Pde6b+ mouse lines. For each group, n=8 retinas from four mice. The fits are exponential with the R-square values for C3H/HeOu and
FVB/N at 0.94 and 0.8, respectively.
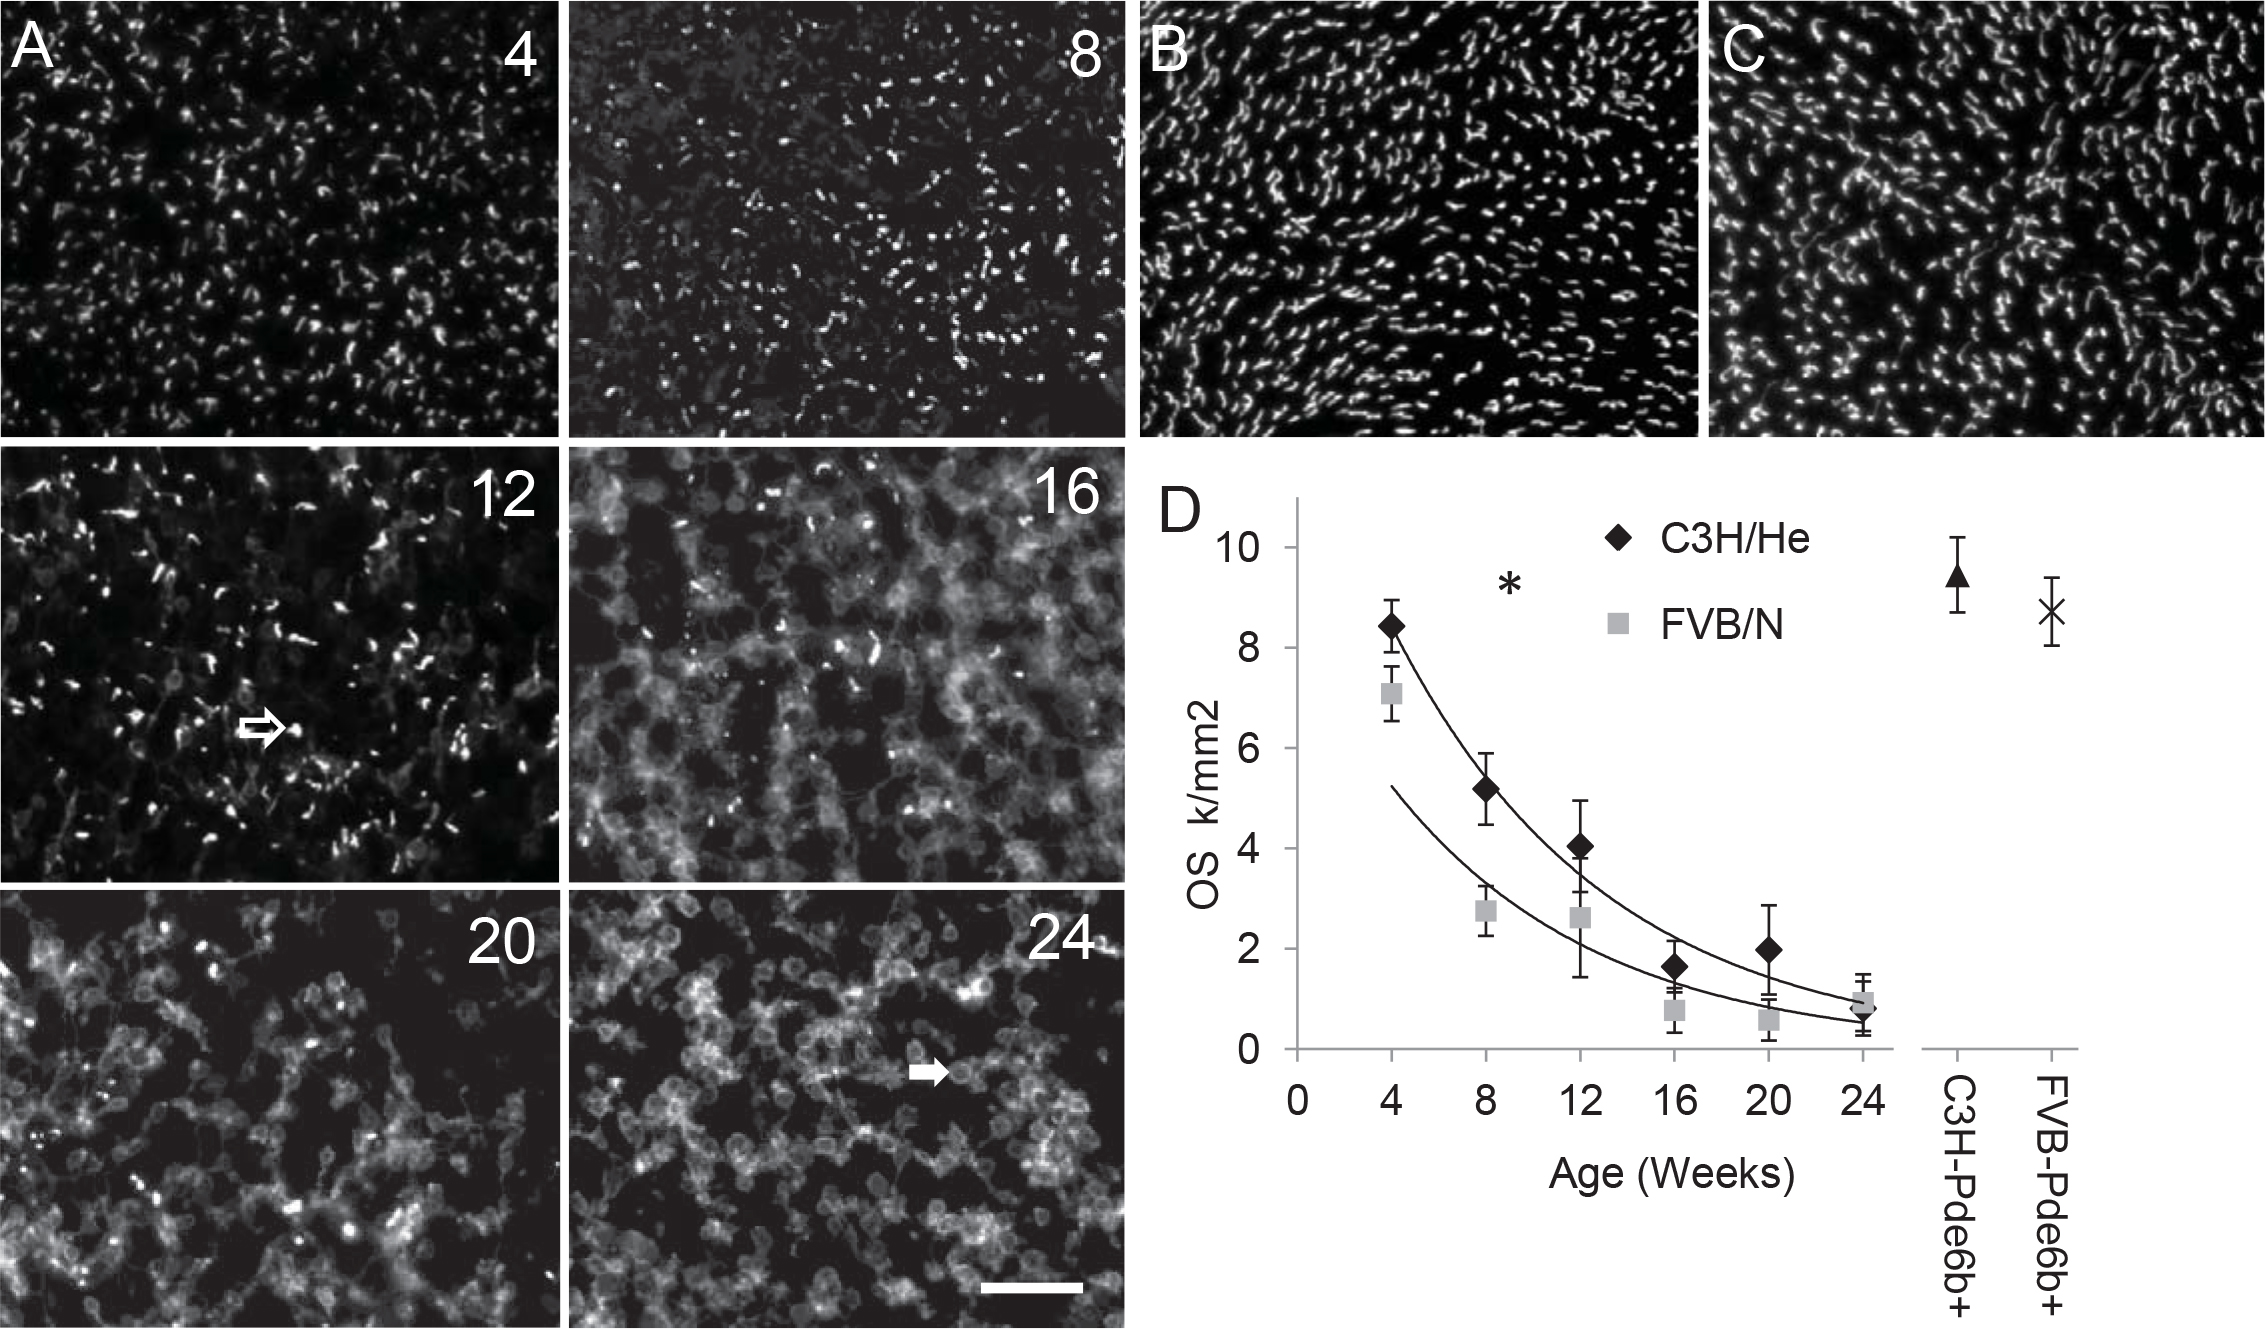
 Figure 4 of
van Wyk, Mol Vis 2015; 21:811-827.
Figure 4 of
van Wyk, Mol Vis 2015; 21:811-827.