Figure 4. AsA concentrations in lenses with selenite-induced cataracts. Group 1: control group. Group 2: hesperetin-treated rats. Group
3: selenite-treated rats. Group 4: rats cotreated with selenite and hesperetin. All results are expressed as the mean ± SEM,
and statistical analysis was determined using the unpaired Student t-test. *p<0.05 versus control (Group 1) and †p<0.05 versus
rats with selenite-induced cataracts without hesperetin treatment (Group 3; m = 9 in each group).
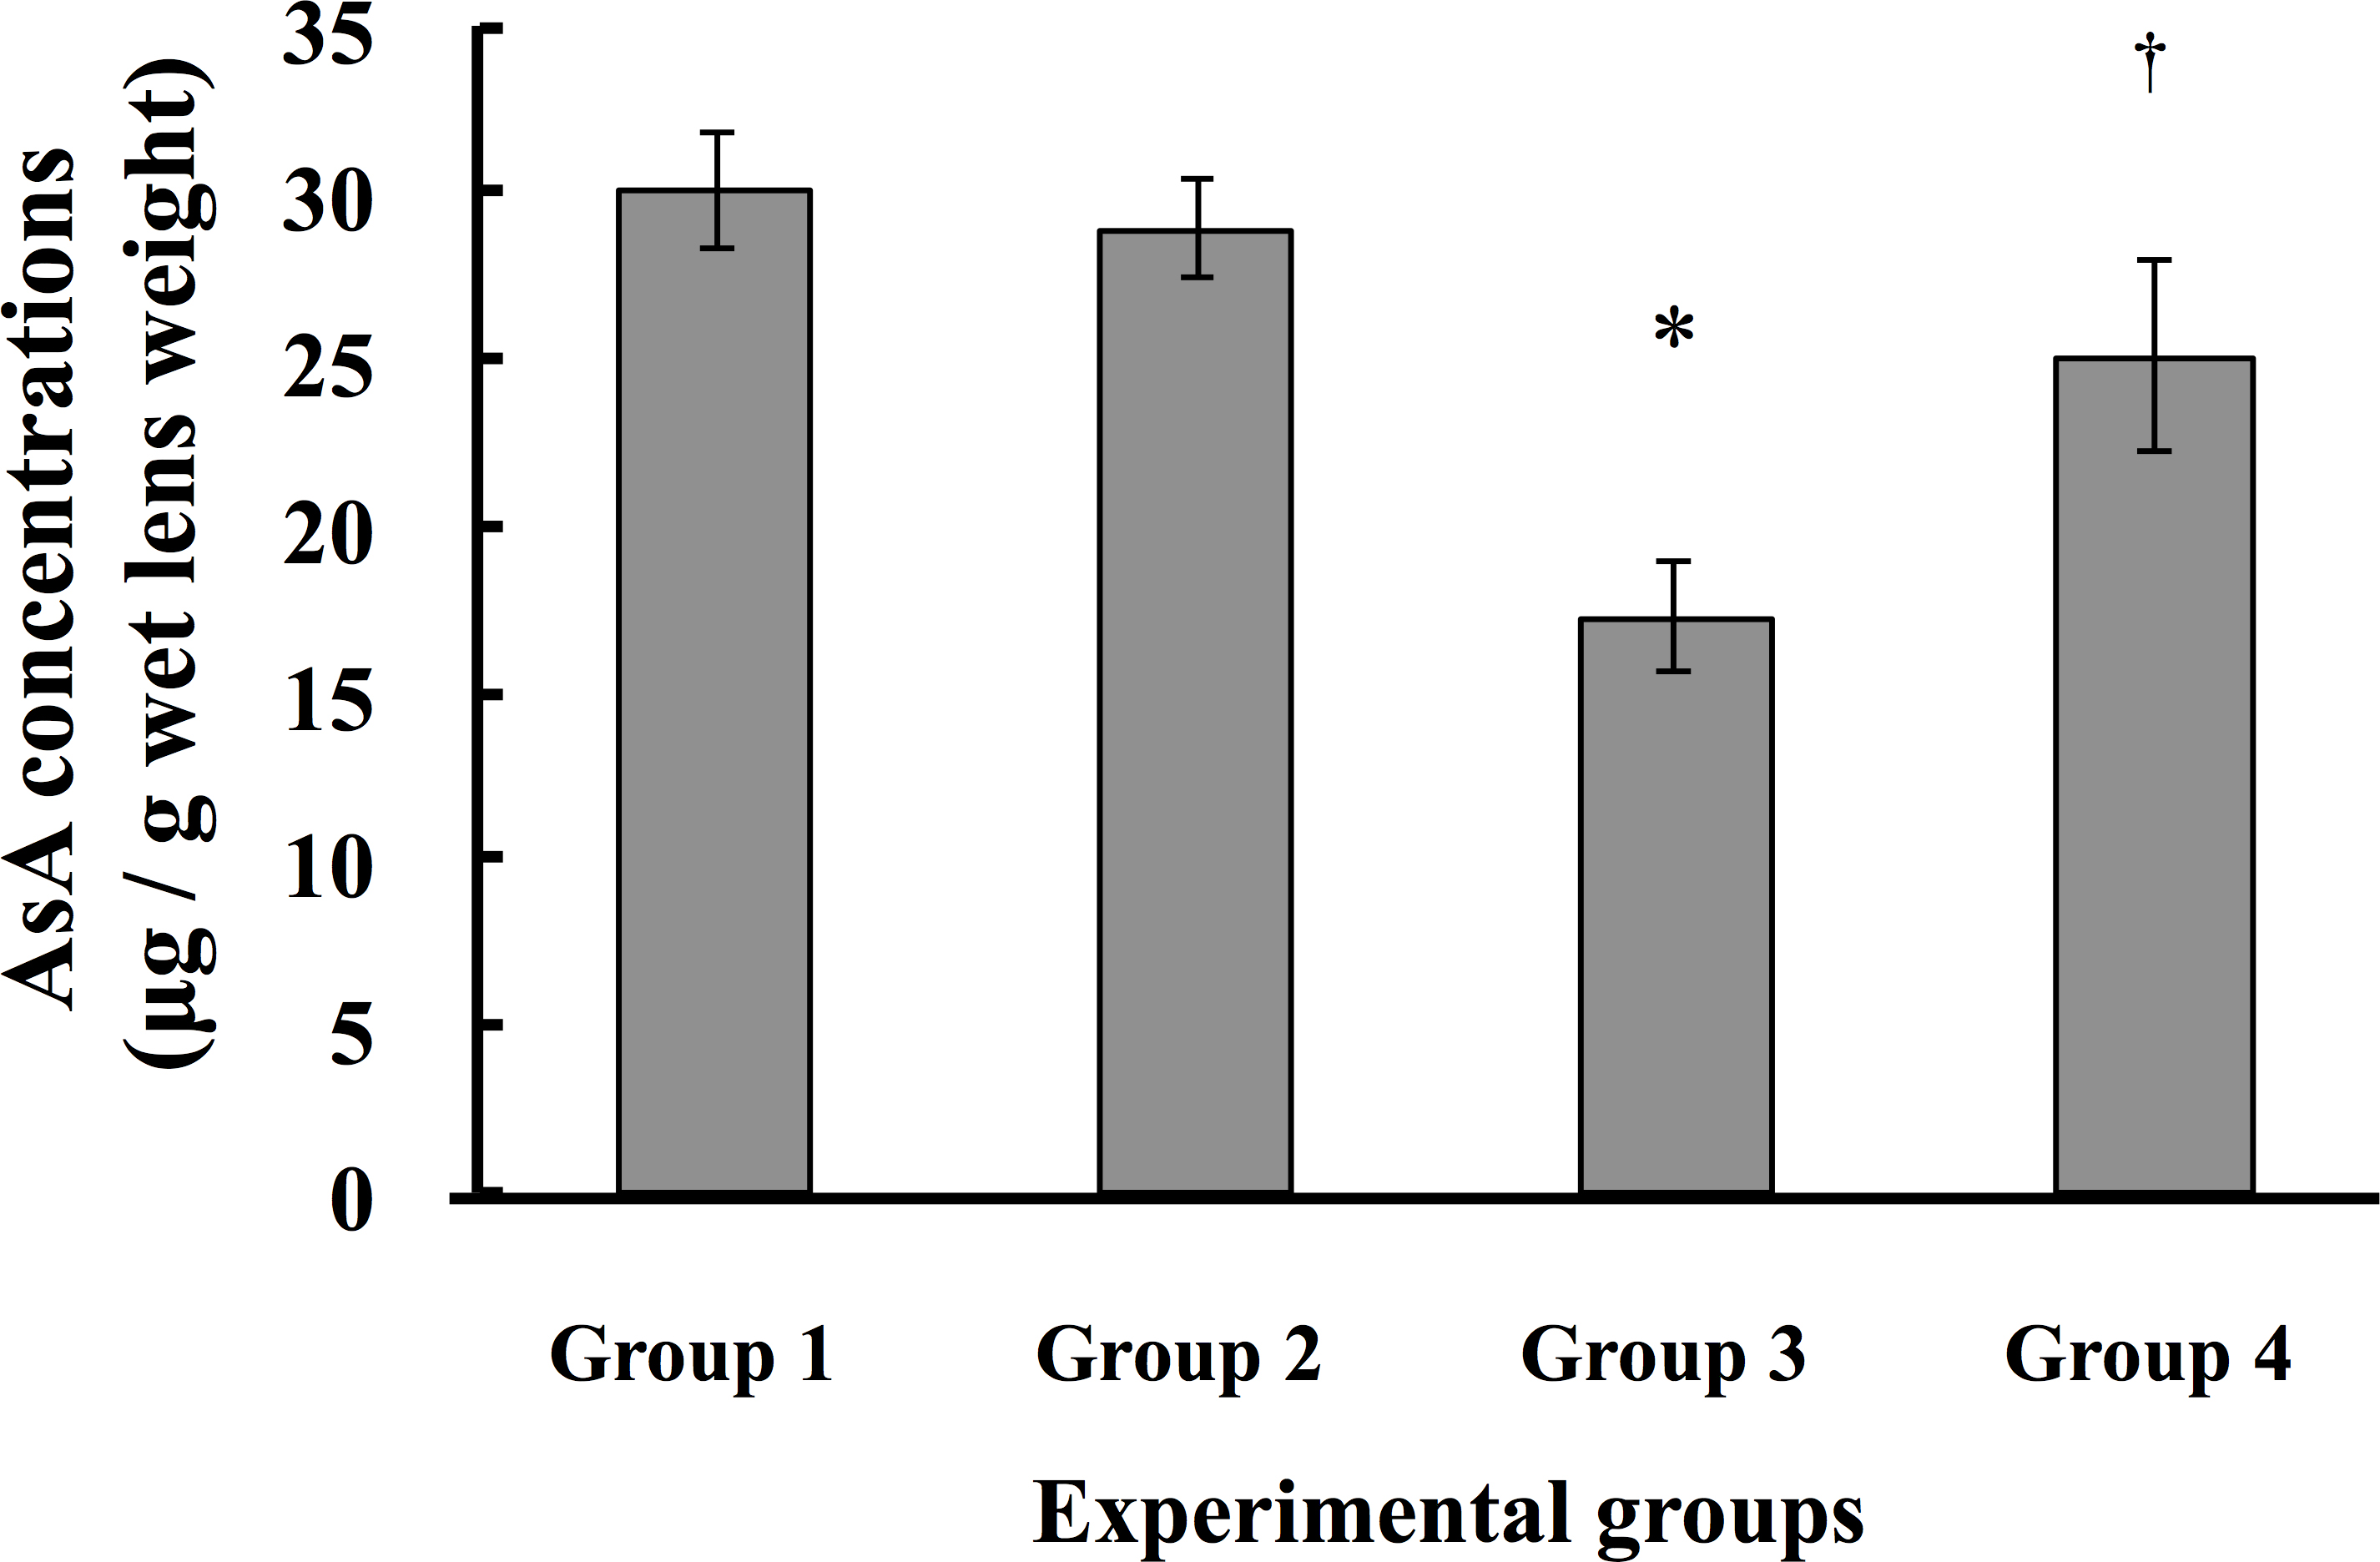
 Figure 4 of
Nakazawa, Mol Vis 2015; 21:804-810.
Figure 4 of
Nakazawa, Mol Vis 2015; 21:804-810.