Figure 1. Distribution of patients with RP by age, origin, consanguinity, and inheritance type. A: The distribution of the studied set of patients by age. Each bar represents the number of patients within each specific
age group, divided into 10-year intervals. Data are presented for all patients (green), men only (blue), and women only (red).
B: The distribution of the cohort of recruited families by origin, inheritance type, and parental relatedness. For each origin
(Arab Muslims and Jews), families are presented by inheritance pattern and relatedness. AR=autosomal recessive and consanguineous
isolate cases; AD=autosomal dominant; XL=X-linked; NR=parents are not related; IC=intracommunity marriages; C=consanguineous
marriages.
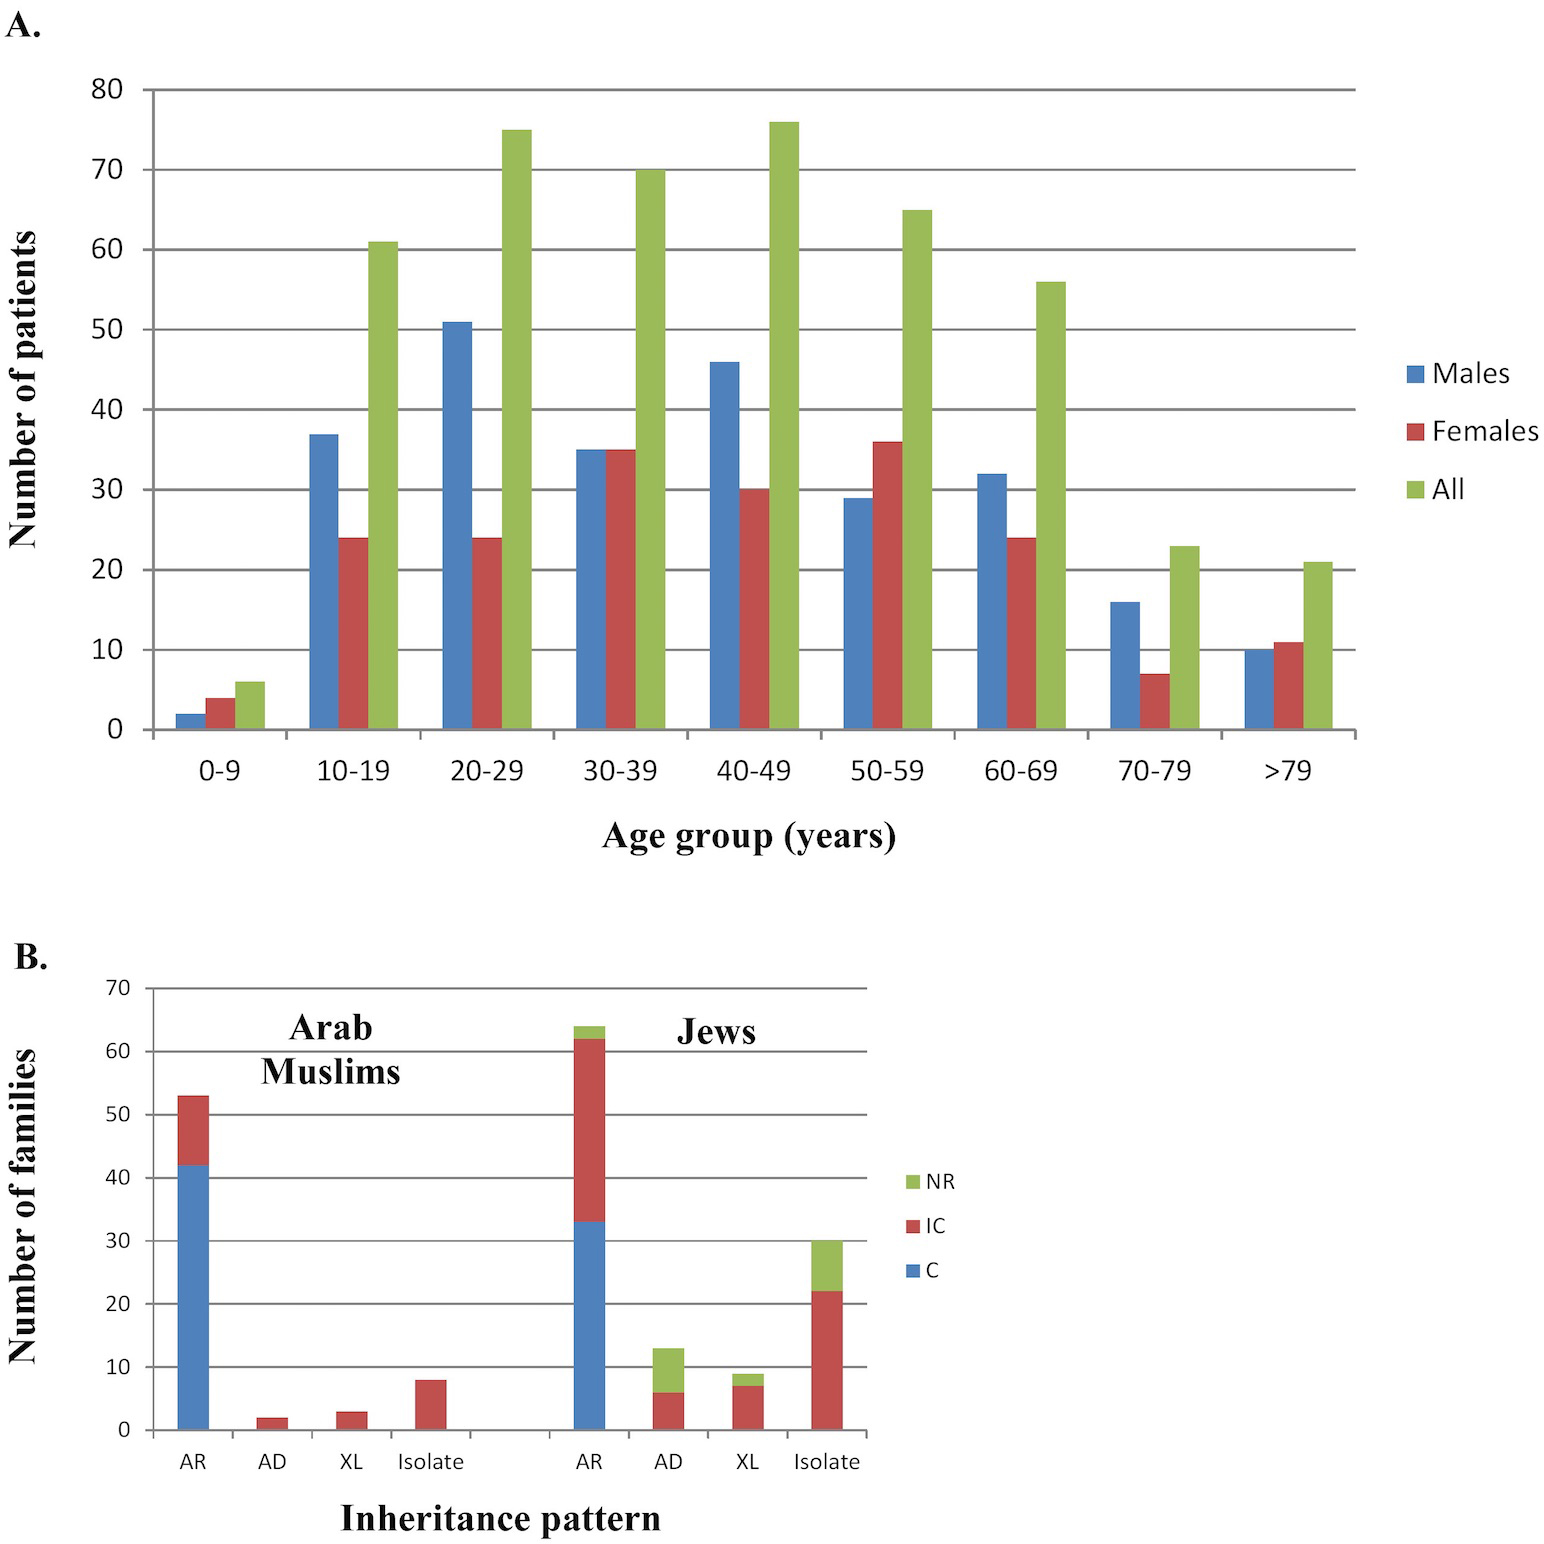
 Figure 1 of
Sharon, Mol Vis 2015; 21:783-792.
Figure 1 of
Sharon, Mol Vis 2015; 21:783-792.