Figure 5 of
Kjellström, Mol Vis 2015; 21:767-782.
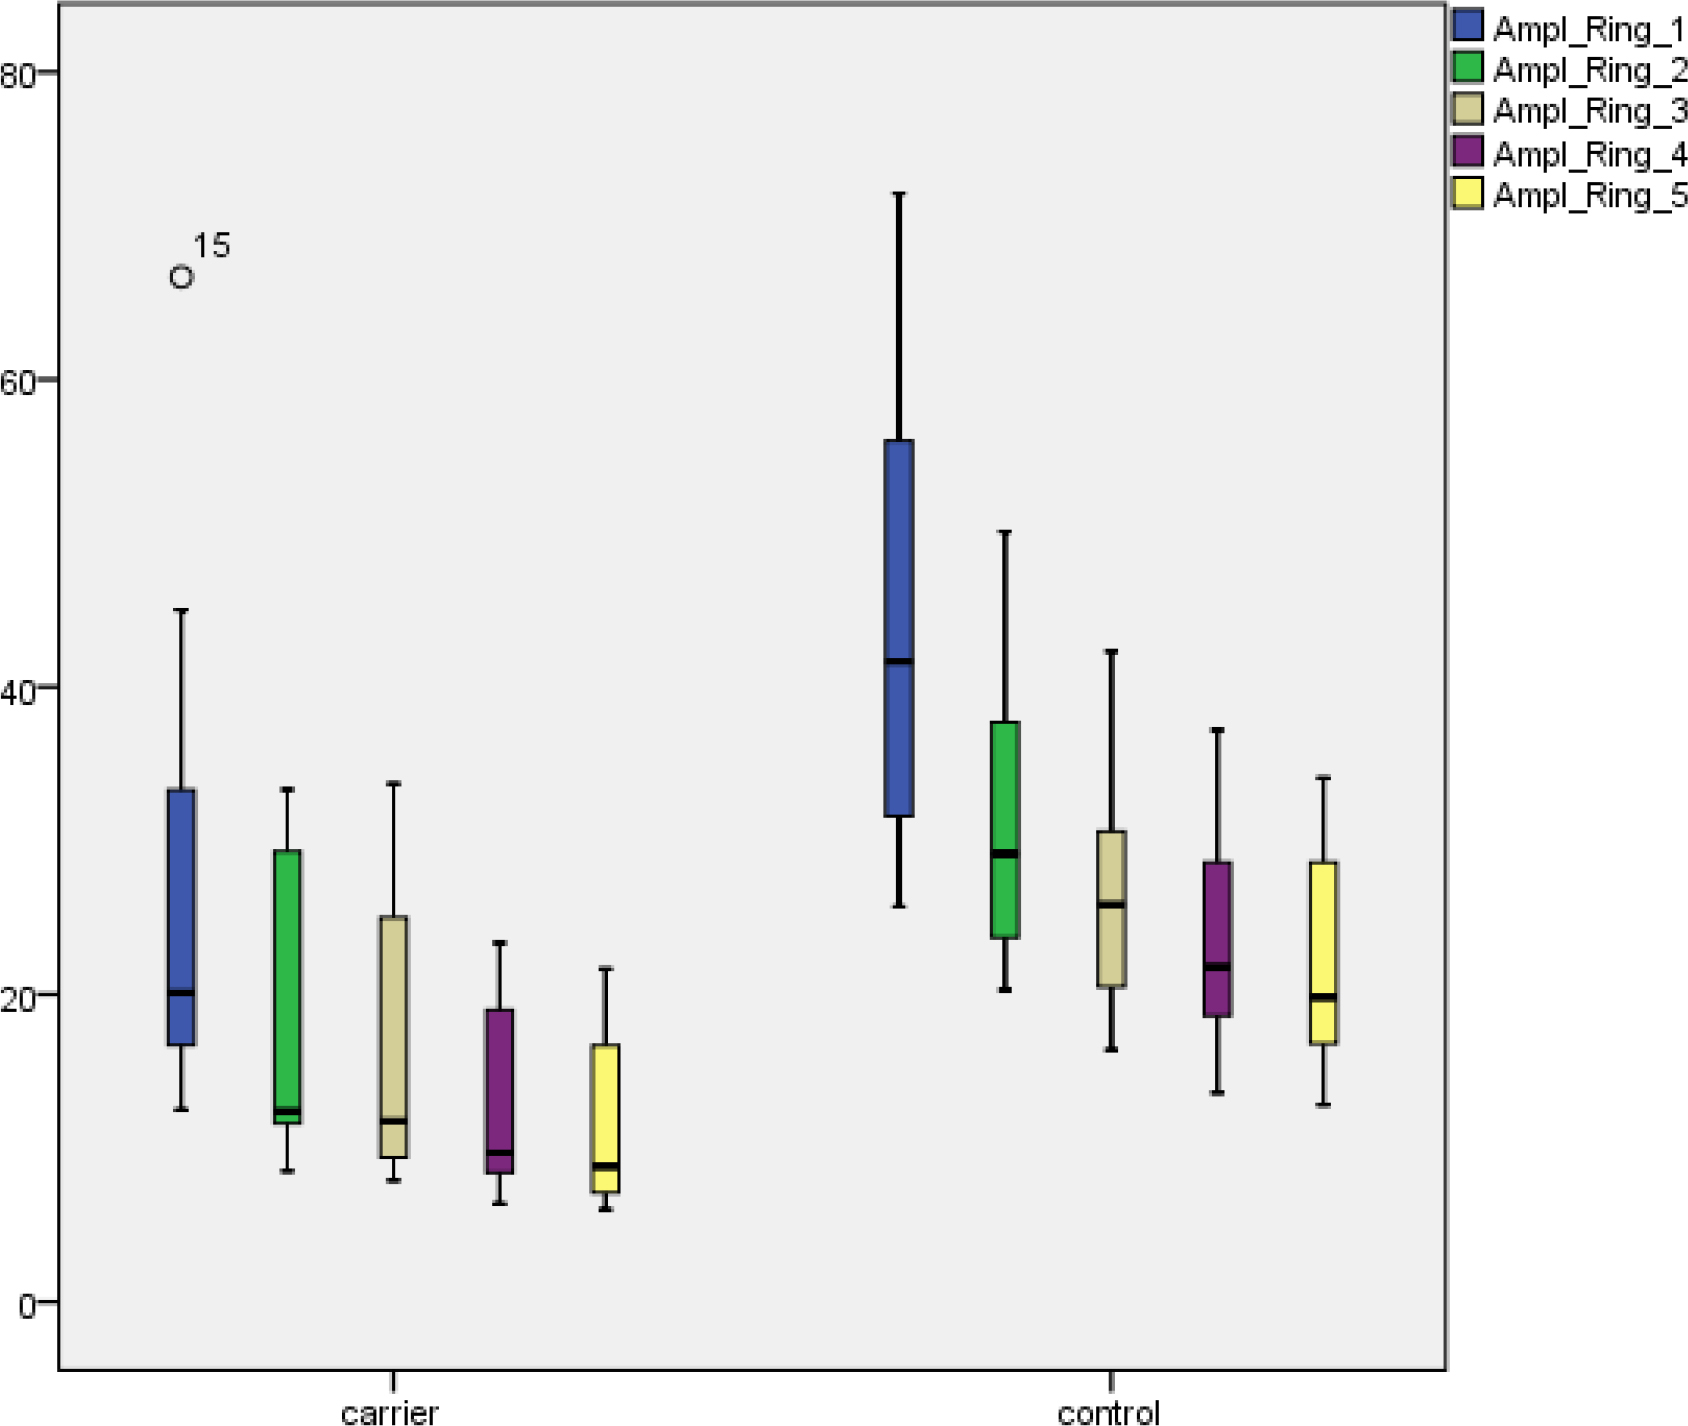
Figure 5.
MERG P1 amplitudes (nV/deg
2
) in rings 1–5 for
ABCA4
carriers and controls. Boxes show the median and interquartile ranges. Bars illustrate range. Circles indicate outliers.
 Figure 5 of
Kjellström, Mol Vis 2015; 21:767-782.
Figure 5 of
Kjellström, Mol Vis 2015; 21:767-782.