Figure 6. Fold changes in TRPP and Piezo expression levels in three mouse models of optic nerve damage. (A–B) an elevated intraocular pressure (IOP) model, (C–D) an optic nerve crush injury model, and (E–F) glaucomatous DBA/2J mice. Quantitative real-time PCR was performed to assess TRPP and Piezo mRNAs in the optic nerve head
prepared from each model (n=3 biologic replicates per time point/severity of glaucoma). The mRNA levels after the elevation
in IOP, optic nerve crush, and in glaucomatous degeneration were normalized to the contralateral control eyes (A–D) and control animals with no or early glaucoma (NOE; E–F), and then presented on a log2 scale. Dashed lines represent the mRNA levels of transient receptor potential (TRP) TRPP and Piezo channels in the control
groups. Error bar, mean ± SEM.
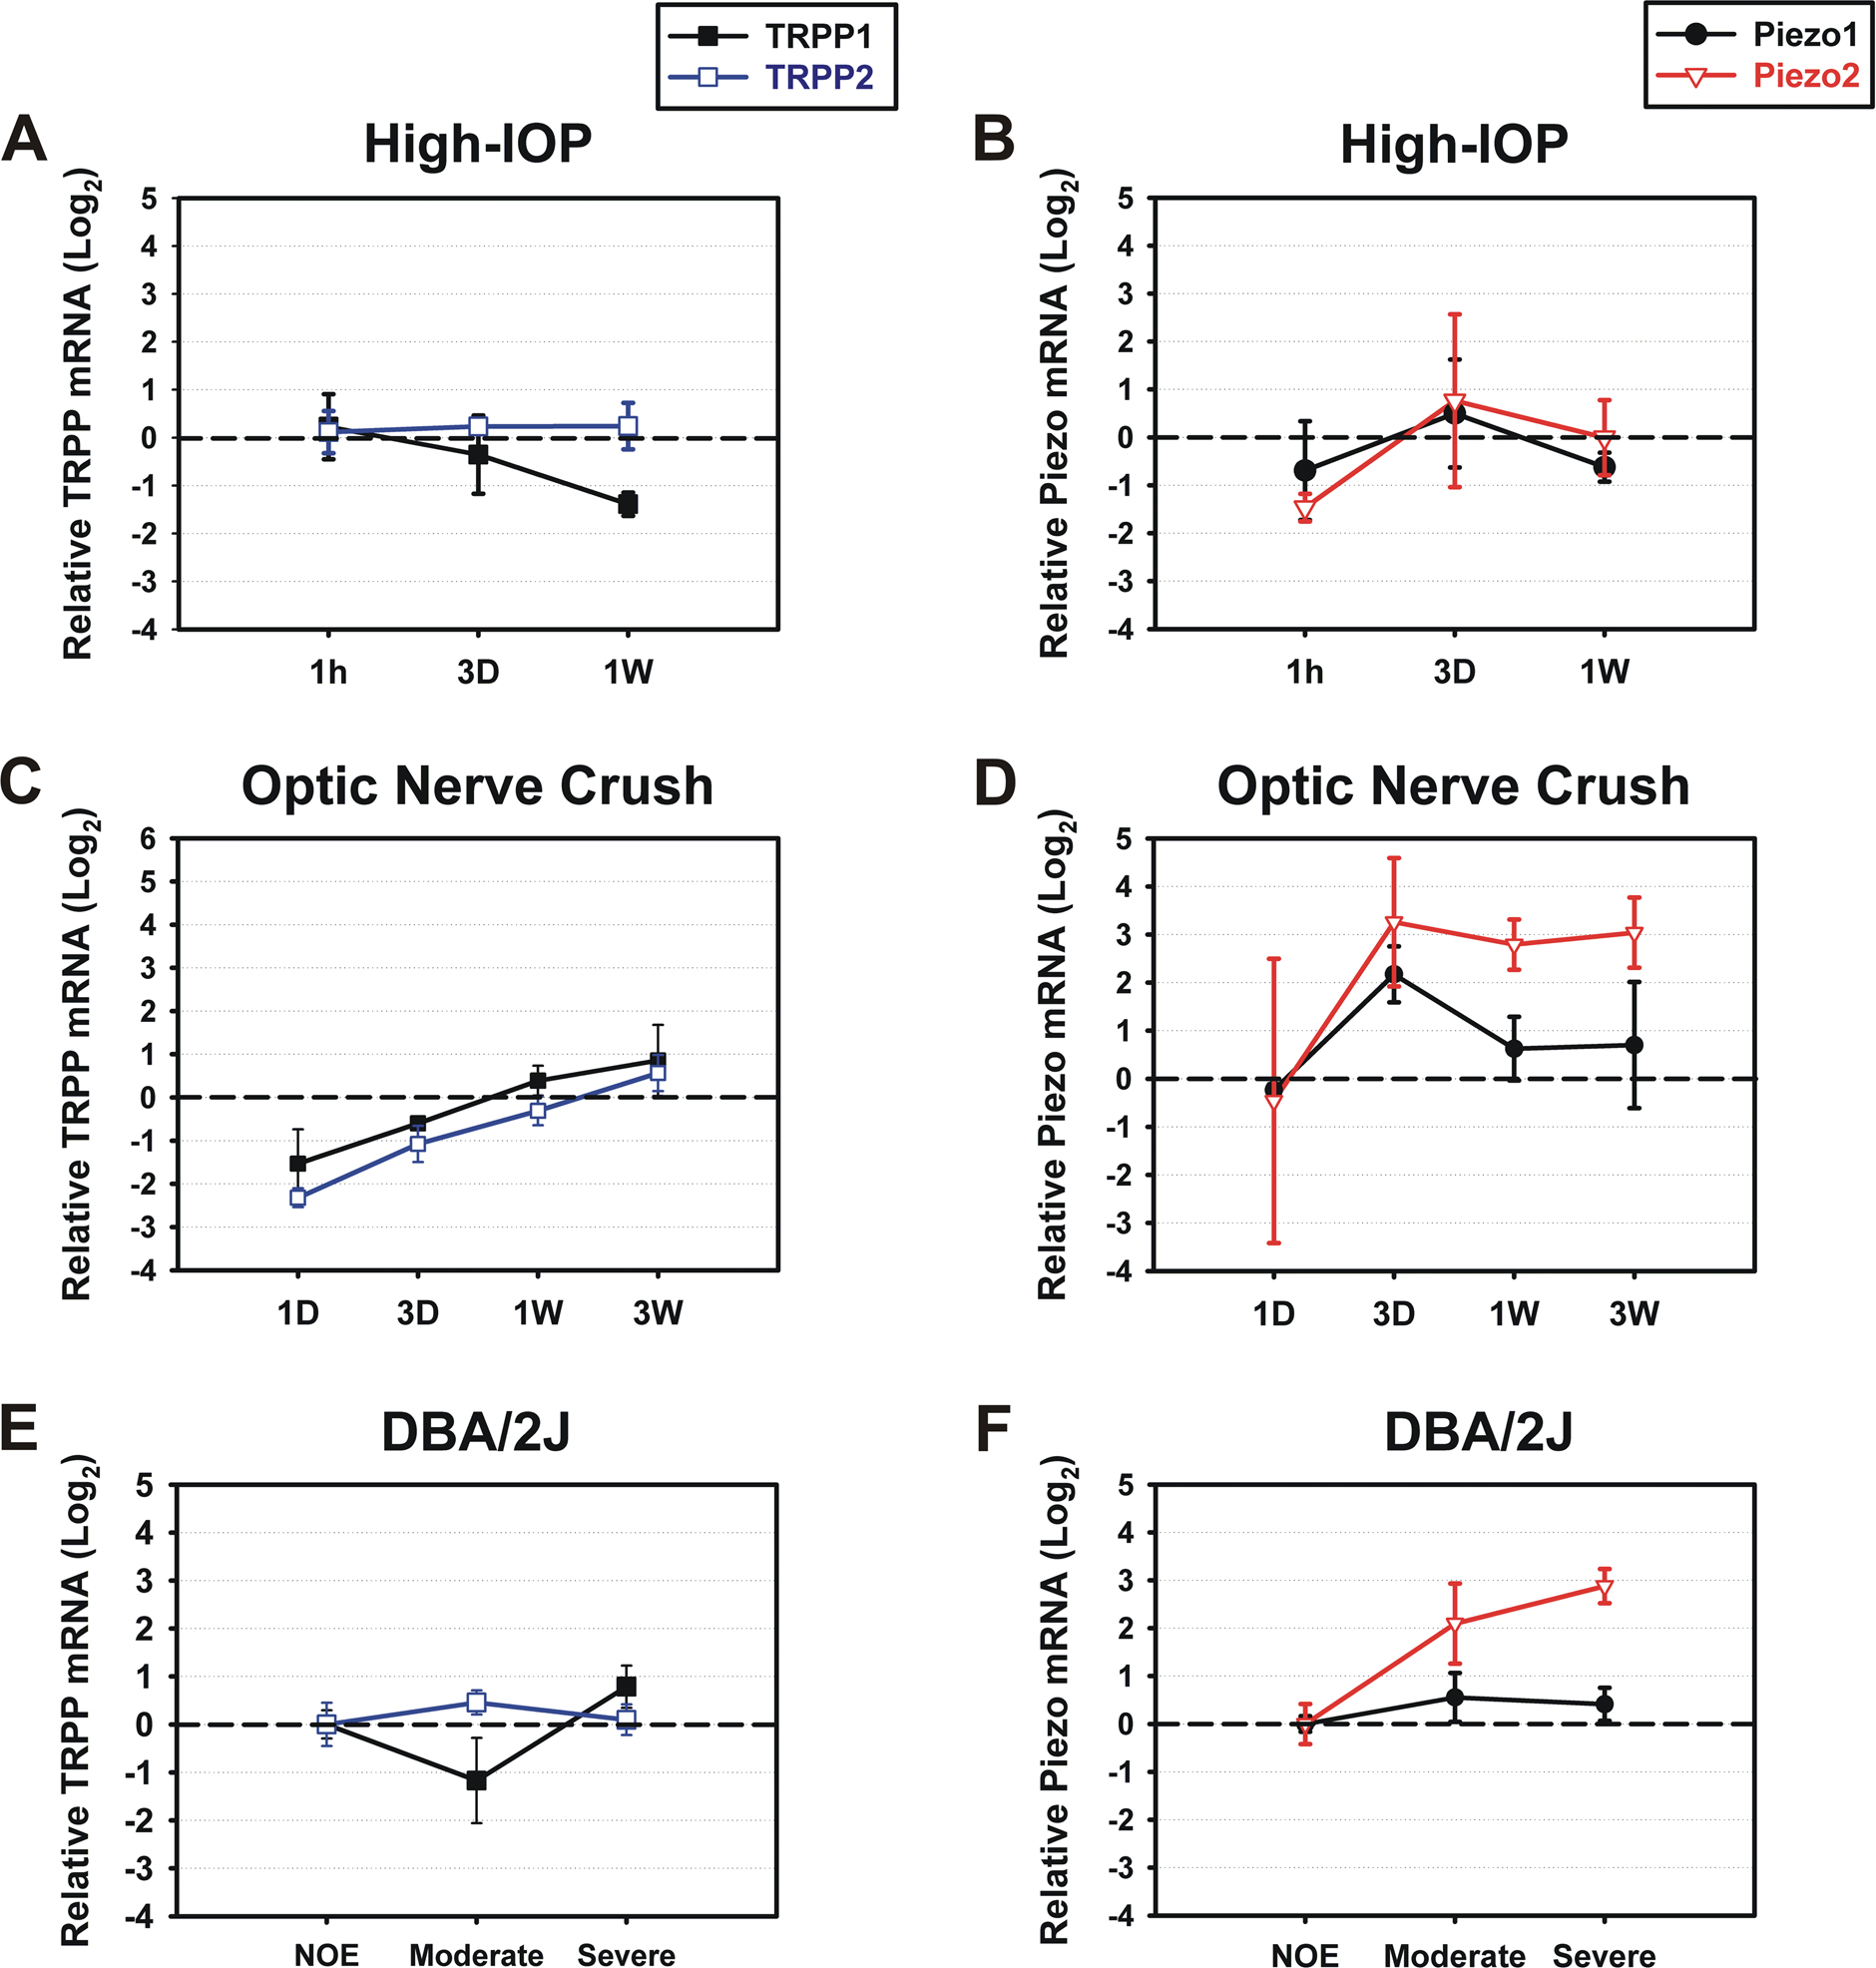
 Figure 6 of
Choi, Mol Vis 2015; 21:749-766.
Figure 6 of
Choi, Mol Vis 2015; 21:749-766.