Figure 3. Western blot and RT–PCR analysis of WWOX expression in pterygium. A: Western blot analysis of WWOX. Pterygium and conjunctiva lysates (n=8/group) were analyzed with western blot with antibodies
against WOX and p-WOX1. Pterygium and conjunctiva lysates (n=8/group) were analyzed with western blot with antibodies against
WOX and p-WOX1. The expression levels were normalized with β-actin. Western blots from three independent experiments were
analyzed with densitometry. The indicated fold changes represent the density relative to the conjunctiva, * p<0.05 compared
with the conjunctiva. B: The mRNA expression amounts of WOX1 (n=8/group), after normalizing to glyceraldehyde-3-phosphate dehydrogenase (GAPDH),
were significantly higher in the head and body of the pterygium tissue compared with the conjunctiva. * p<0.05.
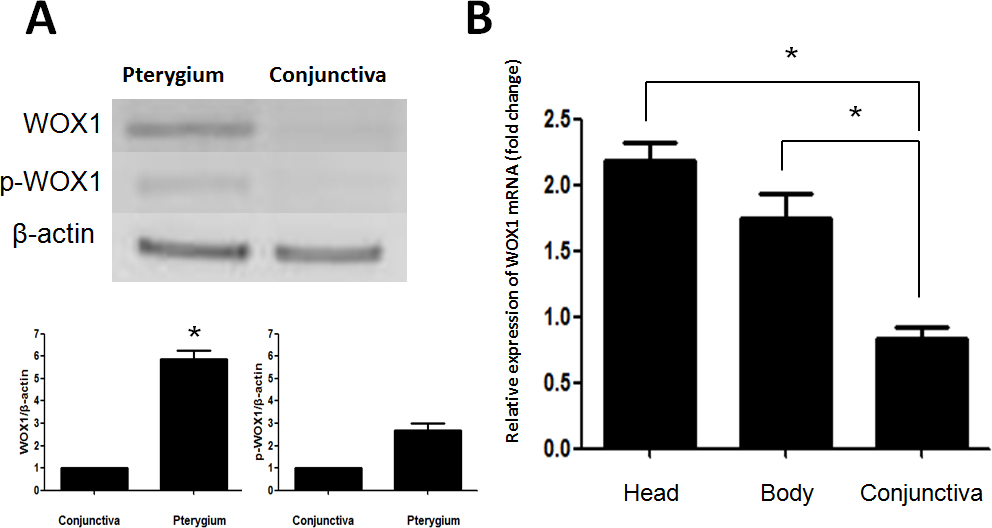
 Figure 3 of
Huang, Mol Vis 2015; 21:711-717.
Figure 3 of
Huang, Mol Vis 2015; 21:711-717.