Figure 3. Detectable LRP6 levels in all plasma samples from 30 subjects with PDR and from 25 subjects as control. There was no significant
difference between the two groups (p=0.636). The box-and-whisker plot represents the median and minimum to maximum range of
plasma LRP6 levels.
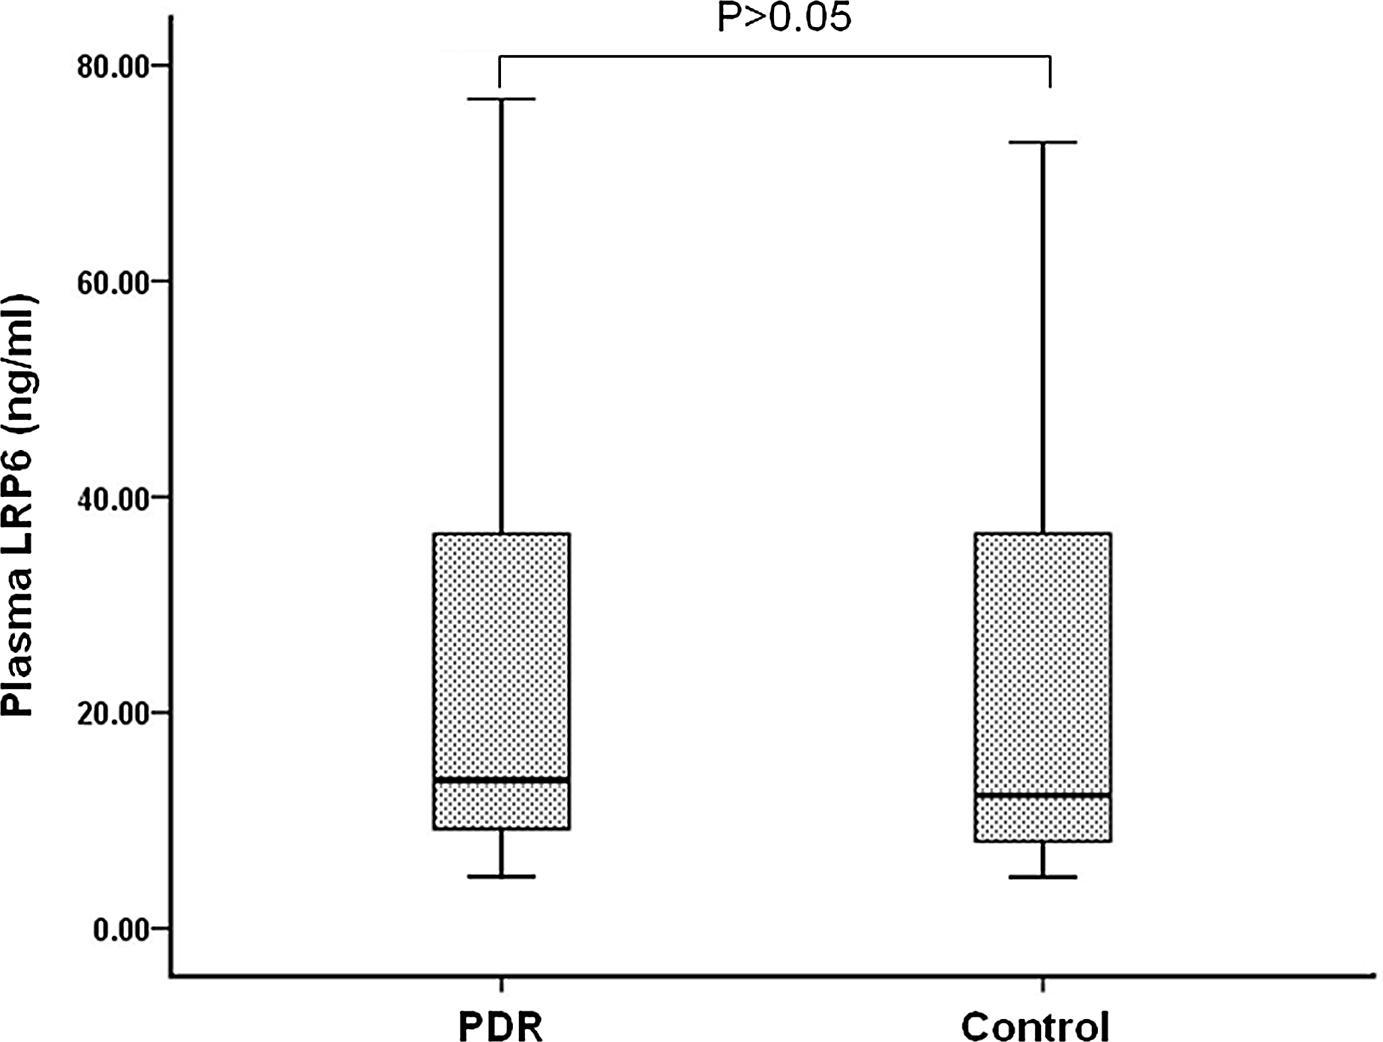
 Figure 3 of
Gao, Mol Vis 2015; 21:665-672.
Figure 3 of
Gao, Mol Vis 2015; 21:665-672.