Figure 2. LRP6 and VEGF concentrations were measured in the vitreous fluid of 16 patients with active PDR and 14 patients with quiescent
PDR. The box-and-whisker plot represents the median and minimum to maximum range of vitreous LRP6 or VEGF levels. There was
a statistically significant difference between the two groups for (A) lipoprotein receptor-related protein 6 (LRP6; p=0.022) and (B) vascular endothelial growth factor (VEGF; p=0.015).
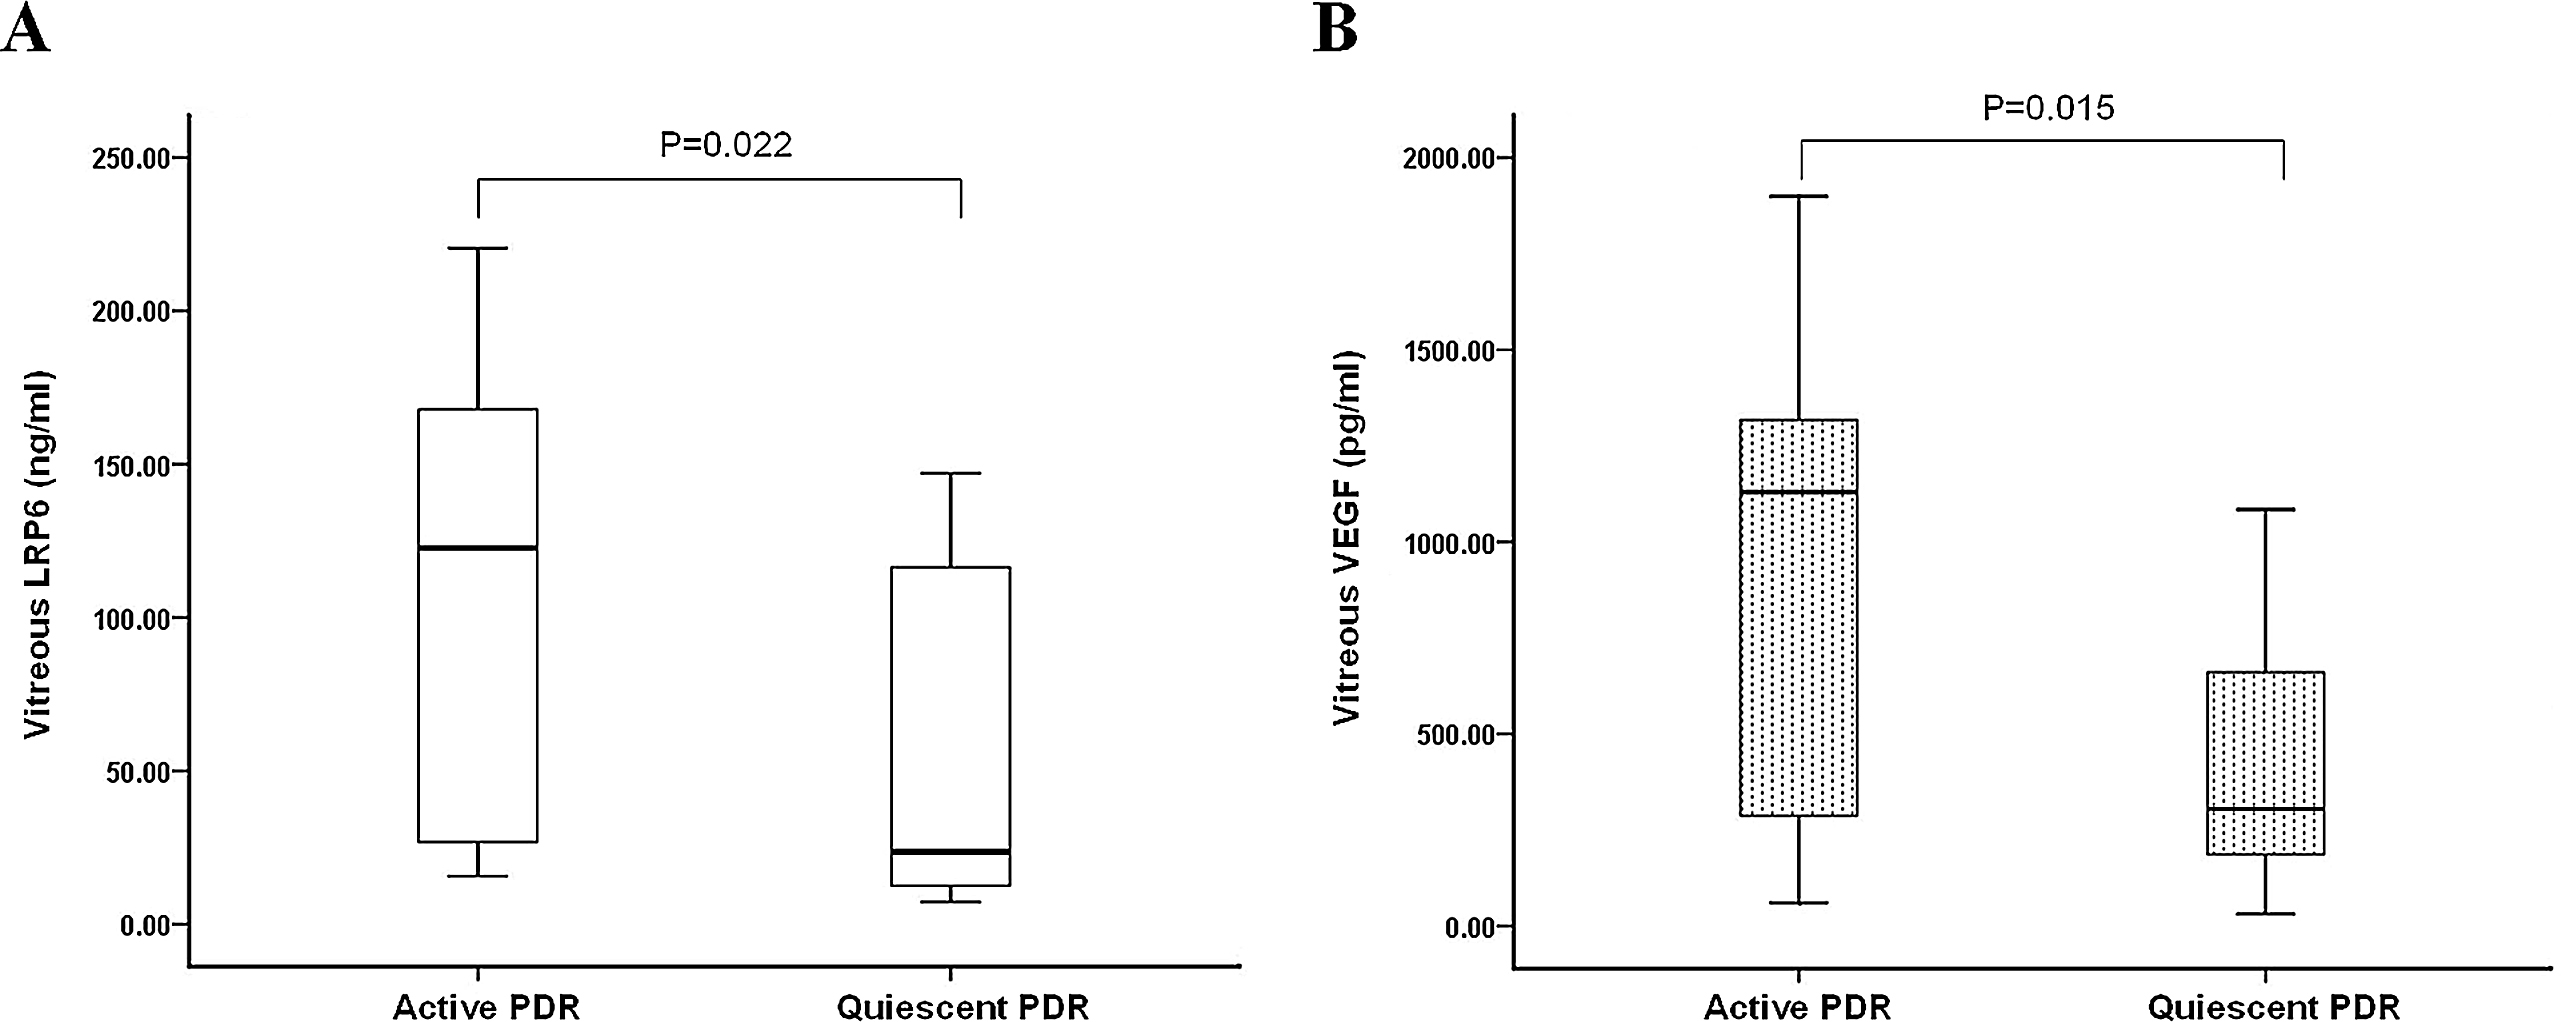
 Figure 2 of
Gao, Mol Vis 2015; 21:665-672.
Figure 2 of
Gao, Mol Vis 2015; 21:665-672.