Figure 3. Comparison of SNP-heritability estimation for a simulated refractive error trait before and after the addition of measurement
error “noise.” Traits were simulated using a model designed to yield a specified SNP-heritability level (x-axis). The simulated
trait was either analyzed directly (“cyclo”) or after the addition of noise designed to mimic the measurement error of non-cycloplegic
autorefraction (“non-cyclo”). Measurement error led to the progressive under-estimation of the true SNP heritability.
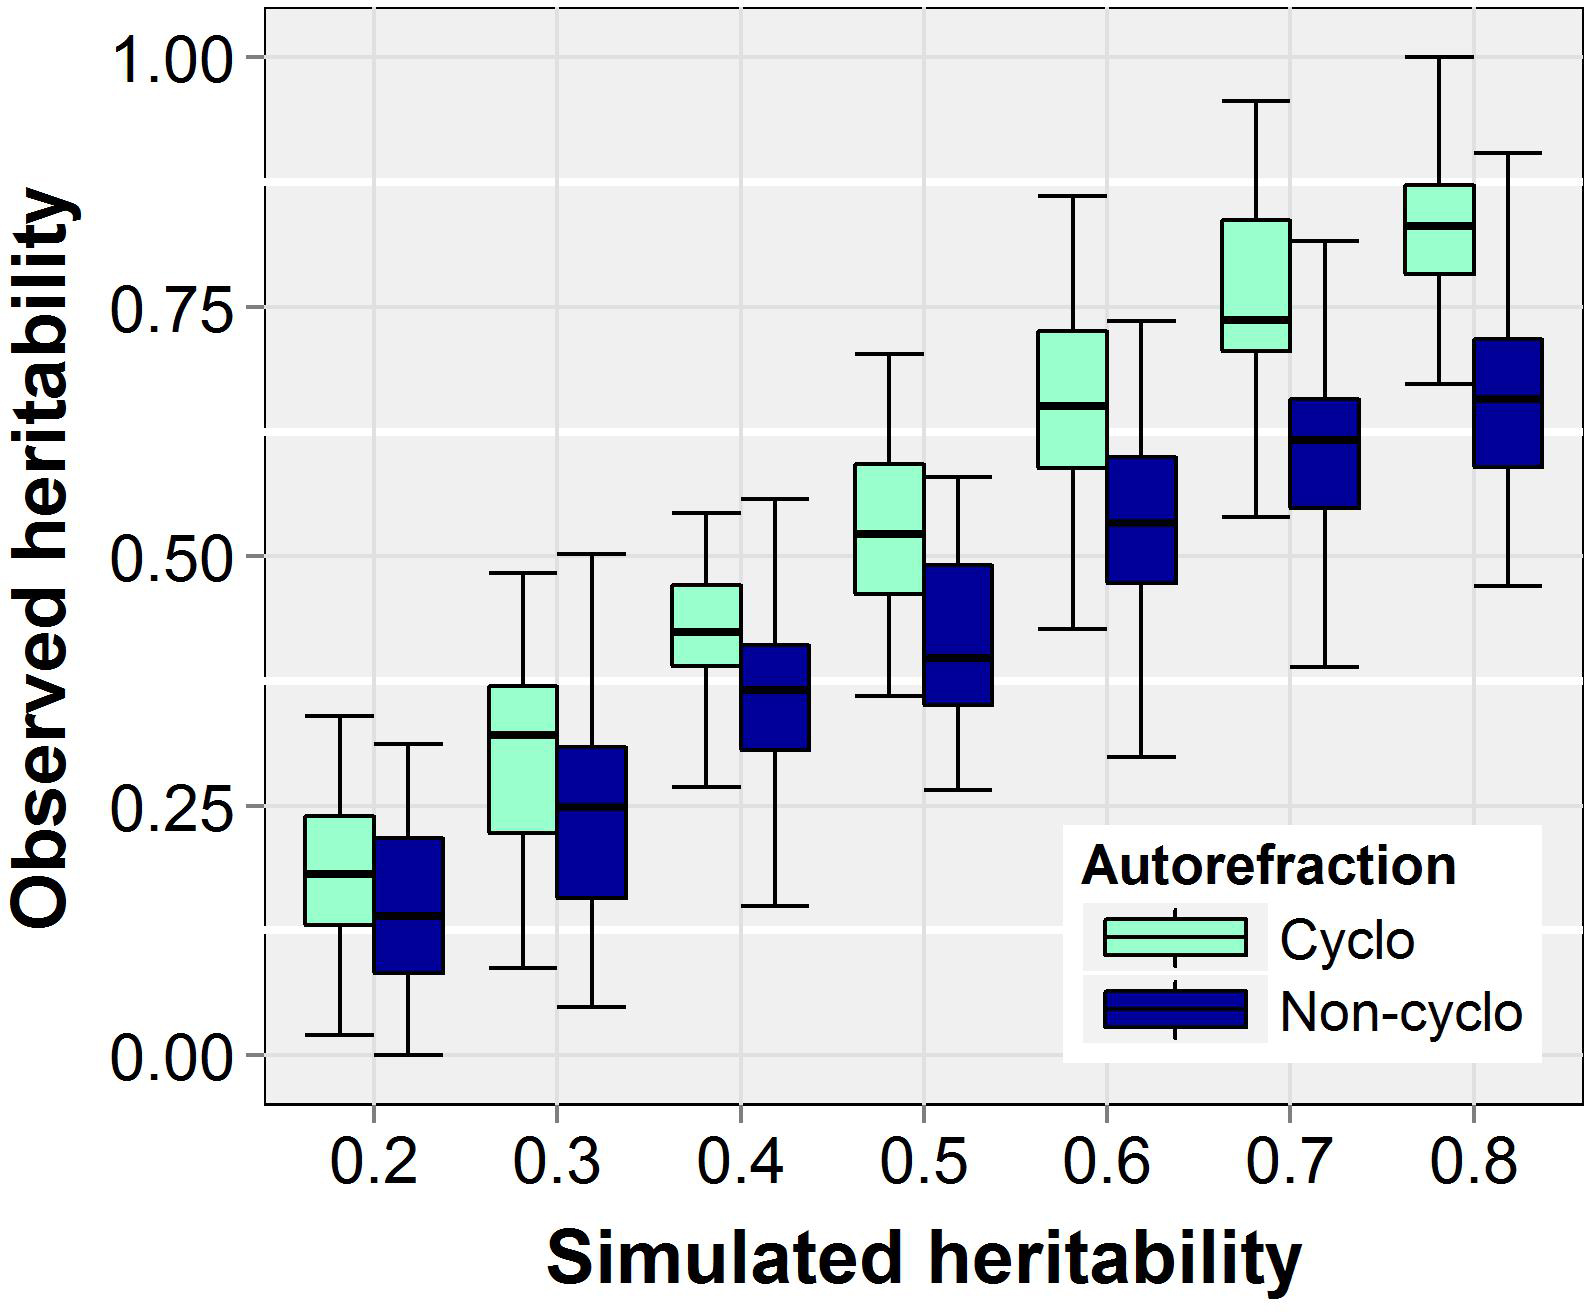
 Figure 3 of
Guggenheim, Mol Vis 2015; 21:621-632.
Figure 3 of
Guggenheim, Mol Vis 2015; 21:621-632.